
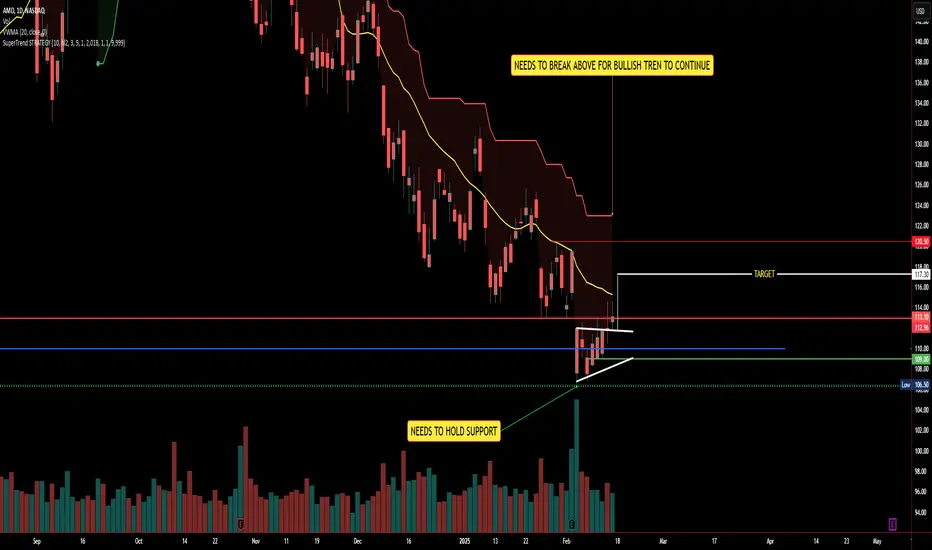
AMD is forming a potential ascending triangle pattern on the daily chart, signaling a possible breakout if momentum continues.
🔍 Key Levels to Watch:
✅ Support Zone: The stock needs to hold above the $108-$109 range for the bullish setup to remain intact.
✅ Breakout Level: A push above $114 could confirm upside continuation.
✅ Target Levels: If AMD breaks out, we could see a move toward $117-$120.50 in the near term.
The yellow 20-day WMA and SuperTrend resistance are key hurdles. A strong close above them would confirm a shift in momentum.
💬 What’s your outlook on AMD? Do you think it can break out, or will it face resistance? Drop your thoughts below! 👇
🔍 Key Levels to Watch:
✅ Support Zone: The stock needs to hold above the $108-$109 range for the bullish setup to remain intact.
✅ Breakout Level: A push above $114 could confirm upside continuation.
✅ Target Levels: If AMD breaks out, we could see a move toward $117-$120.50 in the near term.
The yellow 20-day WMA and SuperTrend resistance are key hurdles. A strong close above them would confirm a shift in momentum.
💬 What’s your outlook on AMD? Do you think it can break out, or will it face resistance? Drop your thoughts below! 👇

관련 발행물
면책사항
해당 정보와 게시물은 금융, 투자, 트레이딩 또는 기타 유형의 조언이나 권장 사항으로 간주되지 않으며, 트레이딩뷰에서 제공하거나 보증하는 것이 아닙니다. 자세한 내용은 이용 약관을 참조하세요.
관련 발행물
면책사항
해당 정보와 게시물은 금융, 투자, 트레이딩 또는 기타 유형의 조언이나 권장 사항으로 간주되지 않으며, 트레이딩뷰에서 제공하거나 보증하는 것이 아닙니다. 자세한 내용은 이용 약관을 참조하세요.