
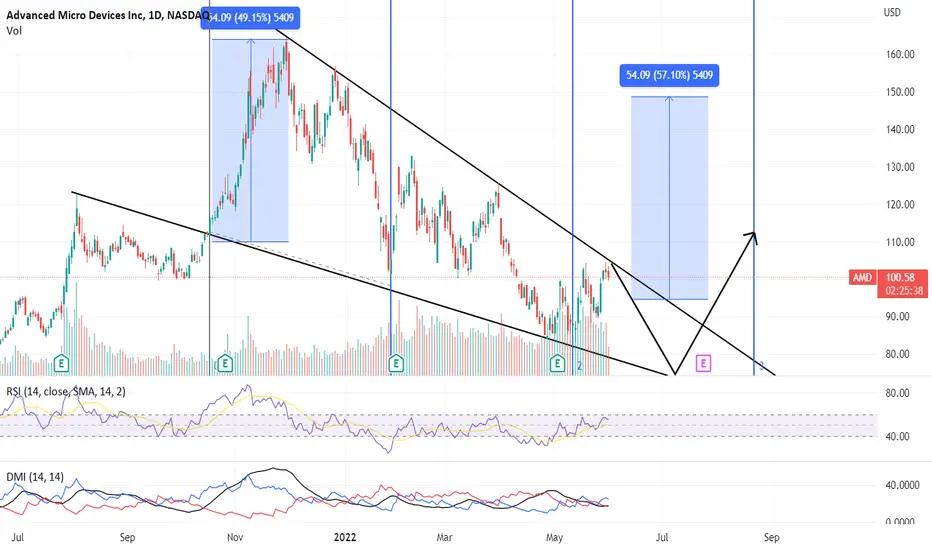
AMD on the daily chart and weekly chart showing a falling wedge pattern. It is also resisting the trendline. It needs to break out of the pattern with high volume is currently missing.
On the fib time cycle, it is in the third phase cycle and will take another month to break the pattern. On unconventional rsi it is resisting and going down it is suitable for shorting now up to 70 odd levels.
Then wait for a swing low around $70 - $75 for entry for a minimum risk to reward ratio. after breaking the pattern it may go up to the $150 level.
Watch out closely.
Cheers and Happy Trading..!!
#Keepitsimple #Tradeeasy
On the fib time cycle, it is in the third phase cycle and will take another month to break the pattern. On unconventional rsi it is resisting and going down it is suitable for shorting now up to 70 odd levels.
Then wait for a swing low around $70 - $75 for entry for a minimum risk to reward ratio. after breaking the pattern it may go up to the $150 level.
Watch out closely.
Cheers and Happy Trading..!!
#Keepitsimple #Tradeeasy

면책사항
해당 정보와 게시물은 금융, 투자, 트레이딩 또는 기타 유형의 조언이나 권장 사항으로 간주되지 않으며, 트레이딩뷰에서 제공하거나 보증하는 것이 아닙니다. 자세한 내용은 이용 약관을 참조하세요.
면책사항
해당 정보와 게시물은 금융, 투자, 트레이딩 또는 기타 유형의 조언이나 권장 사항으로 간주되지 않으며, 트레이딩뷰에서 제공하거나 보증하는 것이 아닙니다. 자세한 내용은 이용 약관을 참조하세요.