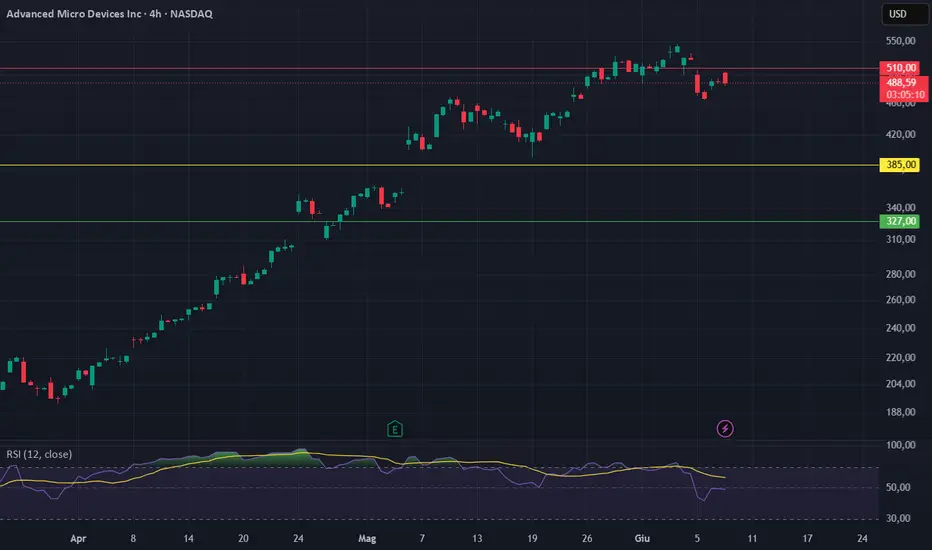
Quick fundamental update on  AMD based on current June 2026 data.
While the charts show strong momentum after the recent $542 peak, a cold look at the Free Cash Flow to the Firm (FCFF) model suggests the stock is heavily extended into overvalued territory.
Here is the breakdown of the Narrative & Numbers backing this view.
1. The Model Inputs (10-Year Framework)
Top-line Growth: Assumed a 35% CAGR for the next 5 years, tracking aggressive AI Data Center expansion and sustained market share gains against Intel.
Target Operating Margin: 26.0% (assuming scaling efficiencies from high-margin AI chips).
Sales-to-Capital: 1.85 (reflecting asset-light, fabless efficiency).
WACC: 9.65% based on a bottom-up sector beta of 1.25 (levered to 1.28).
2. Intrinsic Value Output
Discounting the cash flows and adding net cash yields an intrinsic value of $385.00 per share.
At the current price of ~$489, the market is pricing in an implied revenue growth north of 40% with margins above 30%. There is zero margin for error left at these multiples (P/E currently sitting well over 160x).
3. Key Trading Levels to Watch
Take Profit / Short Zone ($510 - $540): A retest of the old highs represents a heavy fundamental wall. Good area to trim longs or look for exhaustion candles to short.
Fair Value Target ($385): The baseline where the fundamentals match the price.
Buy Trigger ($327 and below): This represents a 15% Margin of Safety below fair value. I'm sitting on my hands until we get a macro flush to this zone.
Bottom line: The AI narrative is strong, but the cash flows don't justify chasing the stock here. Risk/Reward is heavily skewed to the downside for mid-term holders.
What's your play here? Holding the trend or looking for a pullback? Let me know in the comments.
AMD based on current June 2026 data.While the charts show strong momentum after the recent $542 peak, a cold look at the Free Cash Flow to the Firm (FCFF) model suggests the stock is heavily extended into overvalued territory.
Here is the breakdown of the Narrative & Numbers backing this view.
1. The Model Inputs (10-Year Framework)
Top-line Growth: Assumed a 35% CAGR for the next 5 years, tracking aggressive AI Data Center expansion and sustained market share gains against Intel.
Target Operating Margin: 26.0% (assuming scaling efficiencies from high-margin AI chips).
Sales-to-Capital: 1.85 (reflecting asset-light, fabless efficiency).
WACC: 9.65% based on a bottom-up sector beta of 1.25 (levered to 1.28).
2. Intrinsic Value Output
Discounting the cash flows and adding net cash yields an intrinsic value of $385.00 per share.
At the current price of ~$489, the market is pricing in an implied revenue growth north of 40% with margins above 30%. There is zero margin for error left at these multiples (P/E currently sitting well over 160x).
3. Key Trading Levels to Watch
Take Profit / Short Zone ($510 - $540): A retest of the old highs represents a heavy fundamental wall. Good area to trim longs or look for exhaustion candles to short.
Fair Value Target ($385): The baseline where the fundamentals match the price.
Buy Trigger ($327 and below): This represents a 15% Margin of Safety below fair value. I'm sitting on my hands until we get a macro flush to this zone.
Bottom line: The AI narrative is strong, but the cash flows don't justify chasing the stock here. Risk/Reward is heavily skewed to the downside for mid-term holders.
What's your play here? Holding the trend or looking for a pullback? Let me know in the comments.

면책사항
해당 정보와 게시물은 금융, 투자, 트레이딩 또는 기타 유형의 조언이나 권장 사항으로 간주되지 않으며, 트레이딩뷰에서 제공하거나 보증하는 것이 아닙니다. 자세한 내용은 이용 약관을 참조하세요.
면책사항
해당 정보와 게시물은 금융, 투자, 트레이딩 또는 기타 유형의 조언이나 권장 사항으로 간주되지 않으며, 트레이딩뷰에서 제공하거나 보증하는 것이 아닙니다. 자세한 내용은 이용 약관을 참조하세요.