
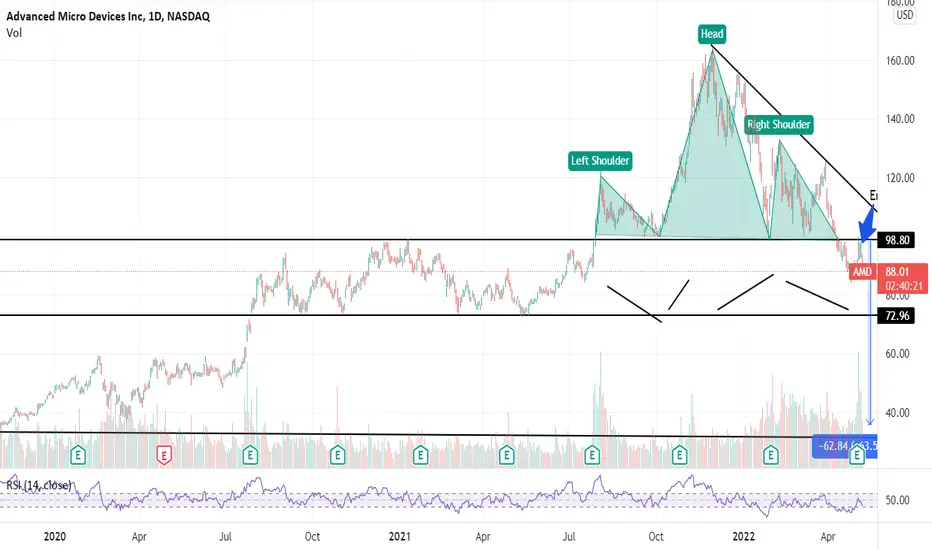
AMD was forming a head and shoulder pattern which is started when it broke the resistance of $98 in Jun 2021 and till Apr 2022 it completed its pattern and it broke down made a low of $84 and again it retests its level of $98-$99 of resistance and came down. To become strong sell the rsi show close below 40 levels currently, it is at 41 levels. Sell below $90 levels Sl is $101 and the target is $74 - $60 and the final target is $36 levels. The time horizon is medium-term.
Fundamentally the company has reported good numbers and being in the semiconductor industry it has demand still intact. But the chart is saying there is a lot of pain ahead.
Overall the market sentiment is negative. So it can be under a lot of pressure.
What are your thoughts guys??
Fundamentally the company has reported good numbers and being in the semiconductor industry it has demand still intact. But the chart is saying there is a lot of pain ahead.
Overall the market sentiment is negative. So it can be under a lot of pressure.
What are your thoughts guys??

면책사항
해당 정보와 게시물은 금융, 투자, 트레이딩 또는 기타 유형의 조언이나 권장 사항으로 간주되지 않으며, 트레이딩뷰에서 제공하거나 보증하는 것이 아닙니다. 자세한 내용은 이용 약관을 참조하세요.
면책사항
해당 정보와 게시물은 금융, 투자, 트레이딩 또는 기타 유형의 조언이나 권장 사항으로 간주되지 않으며, 트레이딩뷰에서 제공하거나 보증하는 것이 아닙니다. 자세한 내용은 이용 약관을 참조하세요.