
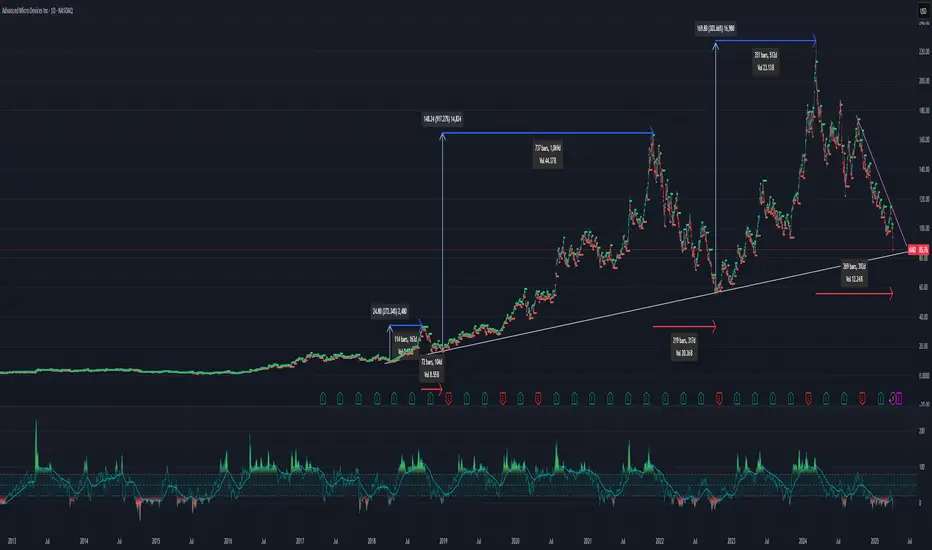
3 Positions in AMD from 2018-2025
Duration of trades: 106 - 1,064 days
Gains: +217% - +917%
Closing in on the trend line, look for a bounce at the line or likely if it goes under, wait for a rally back above the line. This chart is set at the daily timeframe. If you trade on the minor volatility within the major trend, I've found the 2 hour timeframe using a combination of indicators, Relative Trend Index and HH and LL, net favorable results.
Duration of trades: 106 - 1,064 days
Gains: +217% - +917%
Closing in on the trend line, look for a bounce at the line or likely if it goes under, wait for a rally back above the line. This chart is set at the daily timeframe. If you trade on the minor volatility within the major trend, I've found the 2 hour timeframe using a combination of indicators, Relative Trend Index and HH and LL, net favorable results.

면책사항
해당 정보와 게시물은 금융, 투자, 트레이딩 또는 기타 유형의 조언이나 권장 사항으로 간주되지 않으며, 트레이딩뷰에서 제공하거나 보증하는 것이 아닙니다. 자세한 내용은 이용 약관을 참조하세요.
면책사항
해당 정보와 게시물은 금융, 투자, 트레이딩 또는 기타 유형의 조언이나 권장 사항으로 간주되지 않으며, 트레이딩뷰에서 제공하거나 보증하는 것이 아닙니다. 자세한 내용은 이용 약관을 참조하세요.