
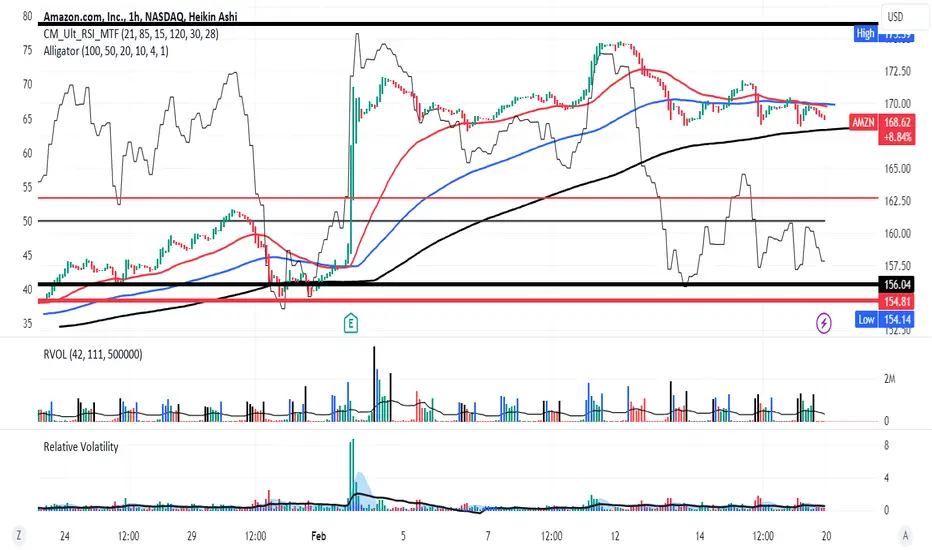
AMZN on the 60 minute chart since earnings shows the jump and the sideways consolidation
after that. Here the RSI is superimposed on the chart within its own 0-100 scale. It is currently
in what should be considered deep undervalued territory and at RSI support /demand. The
William's Alligator set of moving averages shows MA compression and so convergence.
AMZN's price is now in a tight range with volatility likewise compressed especially compared
with that at earnings. In short price is coiled, the potential energy is ready to get converted
to kinetic for those who have an understanding of classical physics.
All that said, I see AMZN as ready to roll. I will take long trades in shares and options as
AMZN is ready to hit the ground running.
after that. Here the RSI is superimposed on the chart within its own 0-100 scale. It is currently
in what should be considered deep undervalued territory and at RSI support /demand. The
William's Alligator set of moving averages shows MA compression and so convergence.
AMZN's price is now in a tight range with volatility likewise compressed especially compared
with that at earnings. In short price is coiled, the potential energy is ready to get converted
to kinetic for those who have an understanding of classical physics.
All that said, I see AMZN as ready to roll. I will take long trades in shares and options as
AMZN is ready to hit the ground running.

면책사항
해당 정보와 게시물은 금융, 투자, 트레이딩 또는 기타 유형의 조언이나 권장 사항으로 간주되지 않으며, 트레이딩뷰에서 제공하거나 보증하는 것이 아닙니다. 자세한 내용은 이용 약관을 참조하세요.
면책사항
해당 정보와 게시물은 금융, 투자, 트레이딩 또는 기타 유형의 조언이나 권장 사항으로 간주되지 않으며, 트레이딩뷰에서 제공하거나 보증하는 것이 아닙니다. 자세한 내용은 이용 약관을 참조하세요.