
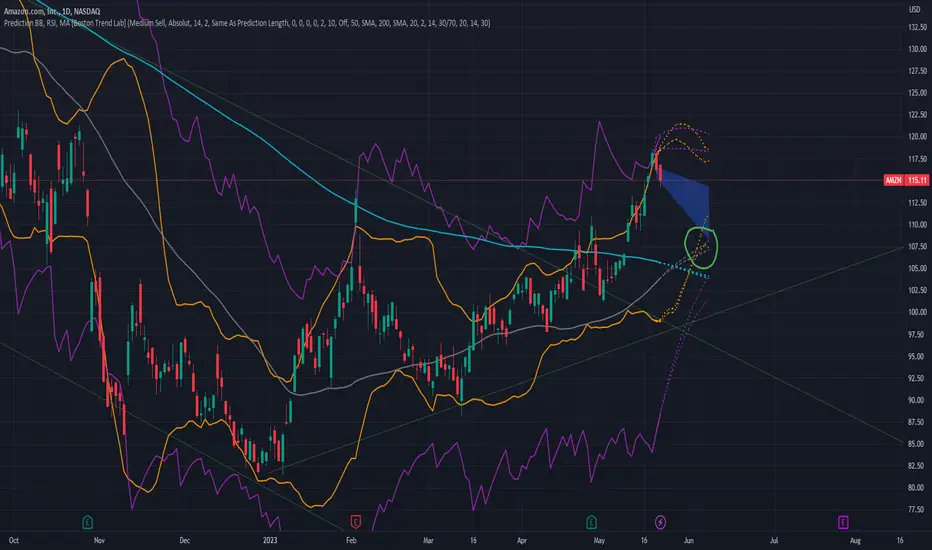
In recent times, the stock price has been increasing exponentially, but it appears that the RSI level of 70 (purple line) has halted the upward momentum. If the uncertain market sentiment continues, the stock may weaken towards the lower Bollinger Band (orange line) and the 50-day moving average (gray line), reaching approximately 107-108 (green circle).
It is important to note that during this period, the 200-day moving average around 104 (turquoise line) and later the lower RSI level, in the case of a steady decline, at approximately 100, could provide support for the stock price.
However, everything can be overridden by the debt ceiling agreement and the FOMC meeting, of course.
It is important to note that during this period, the 200-day moving average around 104 (turquoise line) and later the lower RSI level, in the case of a steady decline, at approximately 100, could provide support for the stock price.
However, everything can be overridden by the debt ceiling agreement and the FOMC meeting, of course.

면책사항
해당 정보와 게시물은 금융, 투자, 트레이딩 또는 기타 유형의 조언이나 권장 사항으로 간주되지 않으며, 트레이딩뷰에서 제공하거나 보증하는 것이 아닙니다. 자세한 내용은 이용 약관을 참조하세요.
면책사항
해당 정보와 게시물은 금융, 투자, 트레이딩 또는 기타 유형의 조언이나 권장 사항으로 간주되지 않으며, 트레이딩뷰에서 제공하거나 보증하는 것이 아닙니다. 자세한 내용은 이용 약관을 참조하세요.