 AMZN
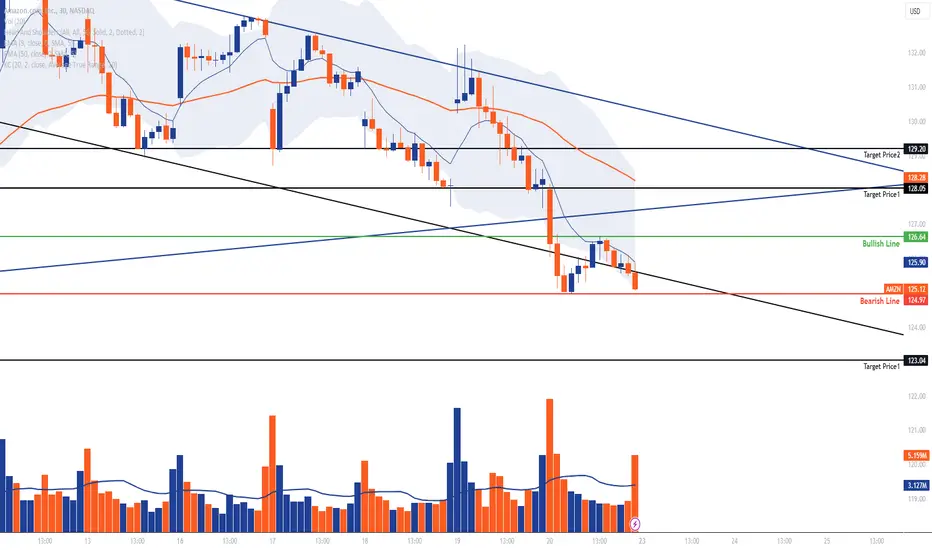
AMZN Trend & Patterns: The stock appears to be in a downtrend, indicated by the series of lower highs and lower lows.
Support & Resistance:
Bearish Line: This line at approximately $124.97 is possibly acting as an immediate support. A breach below this line could see further declines.
Bullish Line: This line at approximately $125.90 might act as a resistance for the stock. A movement above this line could indicate bullish momentum.
Target Prices: Two target prices are highlighted at around $128.05 and $129.20, which might act as resistance points in case of an upward move.
Extended Support: There's another target price marked at $123.04 which could be a future support level if the stock continues its decline.
Moving Averages: The stock is trading below its moving averages, further indicating a bearish sentiment.
Volume: The volume bars seem to be increasing during down days, which can be a bearish sign. An increased volume on declining days can indicate strong selling interest.
Indicators:
Bollinger Bands: The stock price is near the lower Bollinger Band, which can sometimes indicate that the stock is oversold.
Average True Range (ATR): Without exact values, it's a bit tricky, but a rising ATR often indicates increased volatility.
Recent Price Action: The most recent candlestick appears to be a small bullish one, though it's contained within the range of the previous larger bearish candlestick. This could indicate a potential short-term reversal or consolidation, but it would be essential to watch further price action and other confirming indicators.
거래청산: 타겟 닿음

면책사항
해당 정보와 게시물은 금융, 투자, 트레이딩 또는 기타 유형의 조언이나 권장 사항으로 간주되지 않으며, 트레이딩뷰에서 제공하거나 보증하는 것이 아닙니다. 자세한 내용은 이용 약관을 참조하세요.
면책사항
해당 정보와 게시물은 금융, 투자, 트레이딩 또는 기타 유형의 조언이나 권장 사항으로 간주되지 않으며, 트레이딩뷰에서 제공하거나 보증하는 것이 아닙니다. 자세한 내용은 이용 약관을 참조하세요.