
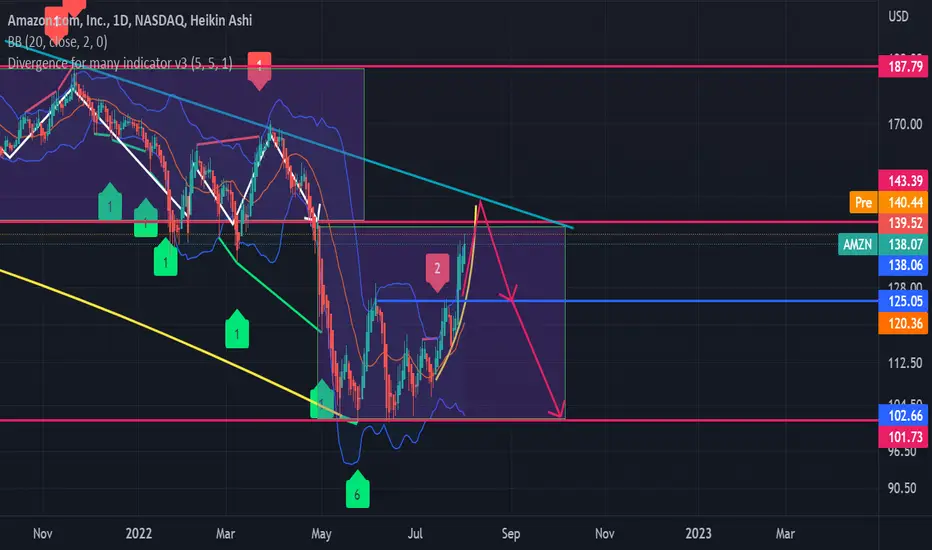
Amazon was marked with a huge growth during the COVID period which makes us focus on the behaviour of the stock within the rectangle of that period. And we notice here that we have a support at 143 and within the rectangle we can notice the oscillation of the price. This also marks a curve format that leads us to the downtrend starting from April 2022.
So, following the trend line above we expect that the price will first rise following the curve in the rectangle then drops either to 124 or 101 which is the limit of the rectangle.
So, following the trend line above we expect that the price will first rise following the curve in the rectangle then drops either to 124 or 101 which is the limit of the rectangle.
노트
The price got rejected at the resistance as we expected.The trend should continue down and reach the target in a few weeks. Patience is a key

💥 Free signals and ideas ➡ t.me/vfinvestment
면책사항
해당 정보와 게시물은 금융, 투자, 트레이딩 또는 기타 유형의 조언이나 권장 사항으로 간주되지 않으며, 트레이딩뷰에서 제공하거나 보증하는 것이 아닙니다. 자세한 내용은 이용 약관을 참조하세요.
💥 Free signals and ideas ➡ t.me/vfinvestment
면책사항
해당 정보와 게시물은 금융, 투자, 트레이딩 또는 기타 유형의 조언이나 권장 사항으로 간주되지 않으며, 트레이딩뷰에서 제공하거나 보증하는 것이 아닙니다. 자세한 내용은 이용 약관을 참조하세요.