
Hello guys
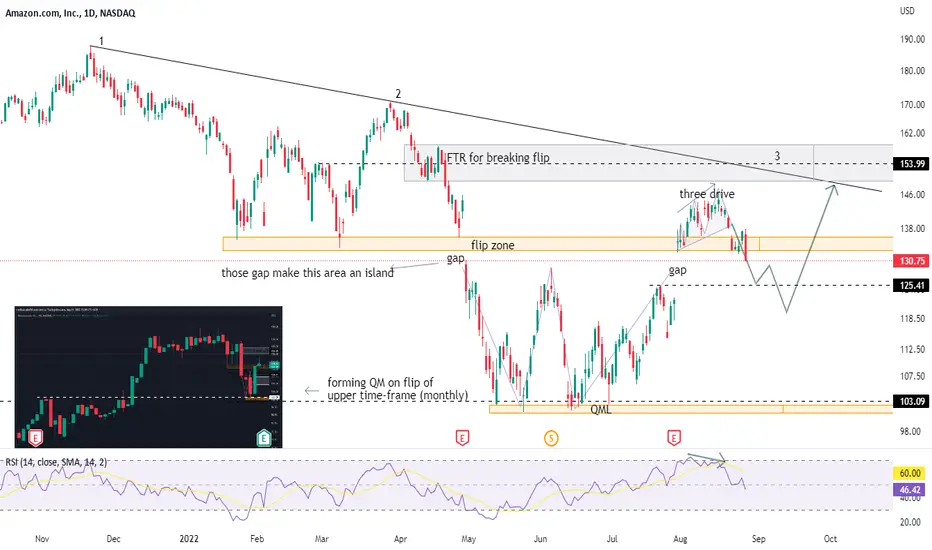
As you see in chart, it formed a QM structure on a flip of monthly time frame, after confirming that structure started bullish movement and in way make a island pattern because of two sides gap. The last gap doesn’t fill so if we get short position, we can put target below that gap(target=$125.41).
Price formed a three-drive pattern and with RSI divergence confirmed this pattern, three drive is a great approach.
always do your own research.
If you have any questions, you can write it in comments below, and I will answer them.
And please don't forget to support this idea with your like and comment.
BE PROFITABLE
As you see in chart, it formed a QM structure on a flip of monthly time frame, after confirming that structure started bullish movement and in way make a island pattern because of two sides gap. The last gap doesn’t fill so if we get short position, we can put target below that gap(target=$125.41).
Price formed a three-drive pattern and with RSI divergence confirmed this pattern, three drive is a great approach.
always do your own research.
If you have any questions, you can write it in comments below, and I will answer them.
And please don't forget to support this idea with your like and comment.
BE PROFITABLE

🟢 Telegram channel: t.me/melikatrader94
🔴 Forex channel: t.me/melikatrader94GoldForex
🟢 ADX & DFM channel: t.me/ADXandDFM
🔴 Tiktok: tiktok.com/@melikatrader94?is_from_webapp=1&sender_device=pc
🔴 Forex channel: t.me/melikatrader94GoldForex
🟢 ADX & DFM channel: t.me/ADXandDFM
🔴 Tiktok: tiktok.com/@melikatrader94?is_from_webapp=1&sender_device=pc
관련 발행물
면책사항
해당 정보와 게시물은 금융, 투자, 트레이딩 또는 기타 유형의 조언이나 권장 사항으로 간주되지 않으며, 트레이딩뷰에서 제공하거나 보증하는 것이 아닙니다. 자세한 내용은 이용 약관을 참조하세요.
🟢 Telegram channel: t.me/melikatrader94
🔴 Forex channel: t.me/melikatrader94GoldForex
🟢 ADX & DFM channel: t.me/ADXandDFM
🔴 Tiktok: tiktok.com/@melikatrader94?is_from_webapp=1&sender_device=pc
🔴 Forex channel: t.me/melikatrader94GoldForex
🟢 ADX & DFM channel: t.me/ADXandDFM
🔴 Tiktok: tiktok.com/@melikatrader94?is_from_webapp=1&sender_device=pc
관련 발행물
면책사항
해당 정보와 게시물은 금융, 투자, 트레이딩 또는 기타 유형의 조언이나 권장 사항으로 간주되지 않으며, 트레이딩뷰에서 제공하거나 보증하는 것이 아닙니다. 자세한 내용은 이용 약관을 참조하세요.