
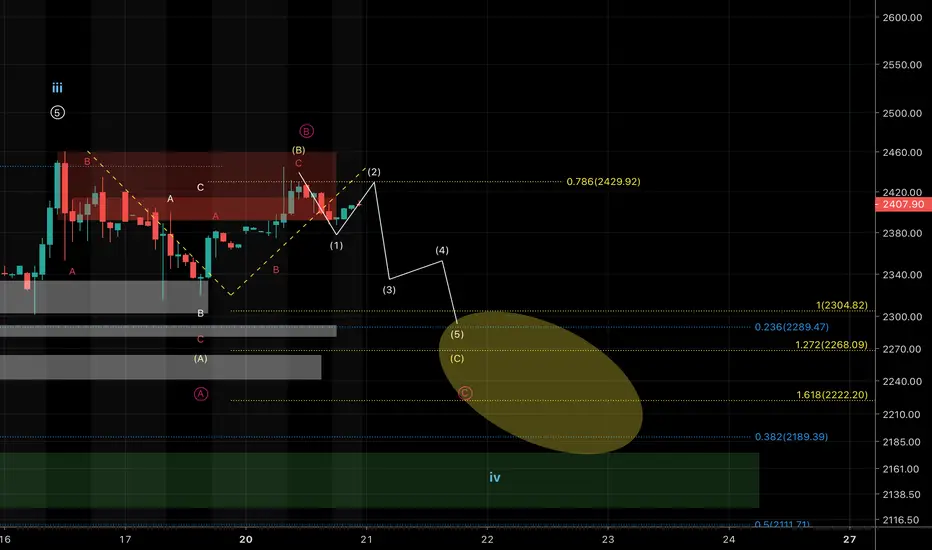
This is playing out pretty nice. We saw first down to demand and saw a bounce back up to the 786 retrace making a lower high (some confirmation of being in corrective phase). Now if that was wave (b), we should see 5 waves down for (c). Overall, a typical wave iii retrace is between .236 and .382 (my blue fib lines). These happen to be in somewhat good alignment with a typical a - b - c projection with c ending between 1x to 1.272x wave a. To add more alignment, we can see there are two good demand zones where all of these projections come together!
I don’t like to trade retrace, but if you want to do a small risk I would look to enter a short as it looks like we are creating a wave 1 - 2 down. For me, I’ll be watching for completion of wave c down, specifically will look for a 1 - 2 wave base to build coming out of a demand zone indicating the beginning of a 5 wave impulse up for overall wave “v”.
I don’t like to trade retrace, but if you want to do a small risk I would look to enter a short as it looks like we are creating a wave 1 - 2 down. For me, I’ll be watching for completion of wave c down, specifically will look for a 1 - 2 wave base to build coming out of a demand zone indicating the beginning of a 5 wave impulse up for overall wave “v”.

면책사항
해당 정보와 게시물은 금융, 투자, 트레이딩 또는 기타 유형의 조언이나 권장 사항으로 간주되지 않으며, 트레이딩뷰에서 제공하거나 보증하는 것이 아닙니다. 자세한 내용은 이용 약관을 참조하세요.
면책사항
해당 정보와 게시물은 금융, 투자, 트레이딩 또는 기타 유형의 조언이나 권장 사항으로 간주되지 않으며, 트레이딩뷰에서 제공하거나 보증하는 것이 아닙니다. 자세한 내용은 이용 약관을 참조하세요.