
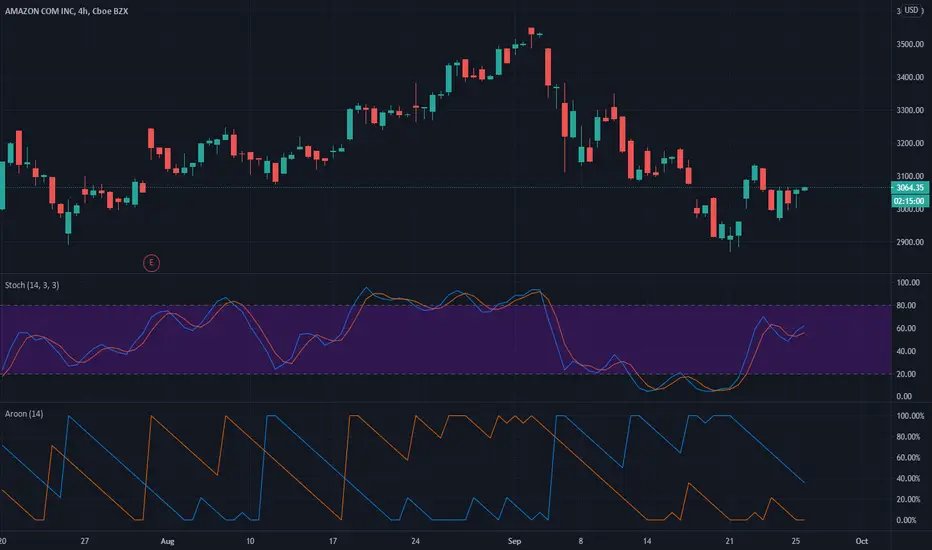
On September 23, 2020, the Stochastic Indicator for AMZN moved out of oversold territory and this could be a bullish sign for the stock. Traders may want to buy the stock or buy call options. Tickeron A.I.dvisor looked at 51 instances where the indicator left the oversold zone. In 42 of the 51 cases the stock moved higher in the following days. This puts the odds of a move higher at over 82%. Current price $3058.75 crossed the support line at $3000.12 and is trading between $3081.11 resistance and $3000.12 support lines. Throughout the month of 08/24/20 - 09/24/20, the price experienced a -9% Downtrend, while the week of 09/17/20 - 09/24/20 shows a +0.37% Uptrend.
Bullish Trend Analysis
Following a +5.89% 3-day Advance, the price is estimated to grow further. Considering data from situations where AMZN advanced for three days, in 285 of 394 cases, the price rose further within the following month. The odds of a continued upward trend are 72%.
AMZN may jump back above the lower band and head toward the middle band. Traders may consider buying the stock or exploring call options.
The Aroon Indicator entered an Uptrend today. In 247 of 348 cases where AMZN Aroon's Indicator entered an Uptrend, the price rose further within the following month. The odds of a continued Uptrend are 71%.
Bullish Trend Analysis
Following a +5.89% 3-day Advance, the price is estimated to grow further. Considering data from situations where AMZN advanced for three days, in 285 of 394 cases, the price rose further within the following month. The odds of a continued upward trend are 72%.
AMZN may jump back above the lower band and head toward the middle band. Traders may consider buying the stock or exploring call options.
The Aroon Indicator entered an Uptrend today. In 247 of 348 cases where AMZN Aroon's Indicator entered an Uptrend, the price rose further within the following month. The odds of a continued Uptrend are 71%.

면책사항
해당 정보와 게시물은 금융, 투자, 트레이딩 또는 기타 유형의 조언이나 권장 사항으로 간주되지 않으며, 트레이딩뷰에서 제공하거나 보증하는 것이 아닙니다. 자세한 내용은 이용 약관을 참조하세요.
면책사항
해당 정보와 게시물은 금융, 투자, 트레이딩 또는 기타 유형의 조언이나 권장 사항으로 간주되지 않으며, 트레이딩뷰에서 제공하거나 보증하는 것이 아닙니다. 자세한 내용은 이용 약관을 참조하세요.