
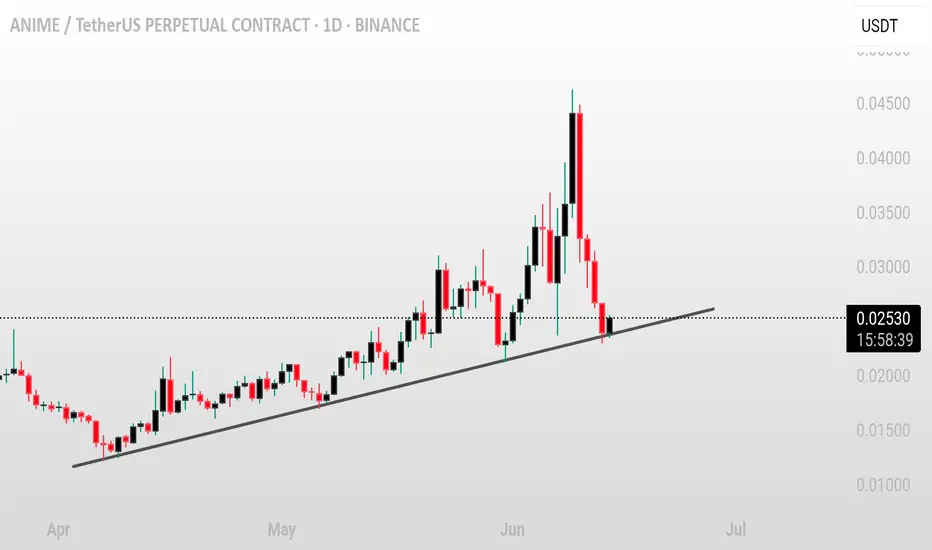
Pair: ANIME/USDT 💱
Timeframe: 1D 📅
Pattern: Ascending Trendline Test 📉
ANIME is currently testing a key ascending trendline on the daily chart. This structure has supported price action for weeks, and the current candle is sitting right at the trendline, suggesting a potential inflection point 🔍⚖️.
Bullish Scenario ✅
If the trendline holds and price rebounds with volume:
🎯 Target 1: 0.032
🎯 Target 2: 0.038
🛑 Suggested SL: below 0.023 (clean breakdown level)
Bearish Risk ❌
A confirmed close below the trendline could trigger a breakdown, potentially sending price toward the 0.020–0.018 support zone.
⚠️ Watch for strong reaction or volume spike — this is a decision point!
Timeframe: 1D 📅
Pattern: Ascending Trendline Test 📉
ANIME is currently testing a key ascending trendline on the daily chart. This structure has supported price action for weeks, and the current candle is sitting right at the trendline, suggesting a potential inflection point 🔍⚖️.
Bullish Scenario ✅
If the trendline holds and price rebounds with volume:
🎯 Target 1: 0.032
🎯 Target 2: 0.038
🛑 Suggested SL: below 0.023 (clean breakdown level)
Bearish Risk ❌
A confirmed close below the trendline could trigger a breakdown, potentially sending price toward the 0.020–0.018 support zone.
⚠️ Watch for strong reaction or volume spike — this is a decision point!

면책사항
해당 정보와 게시물은 금융, 투자, 트레이딩 또는 기타 유형의 조언이나 권장 사항으로 간주되지 않으며, 트레이딩뷰에서 제공하거나 보증하는 것이 아닙니다. 자세한 내용은 이용 약관을 참조하세요.
면책사항
해당 정보와 게시물은 금융, 투자, 트레이딩 또는 기타 유형의 조언이나 권장 사항으로 간주되지 않으며, 트레이딩뷰에서 제공하거나 보증하는 것이 아닙니다. 자세한 내용은 이용 약관을 참조하세요.