롱
ANKRUSD rebounding on the 1D MA50. Levels to watch for a break.
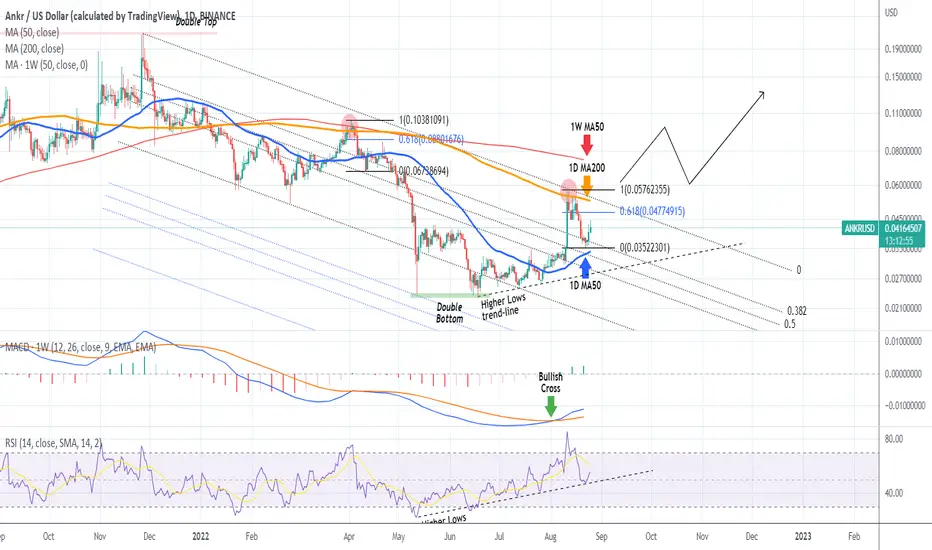
The Ankr Token (ANKRUSD) is on the 3rd straight green 1D candle following a near hit on the 1D MA50 (blue trend-line) which has been supporting since July 29. This rebound is coming after a pull-back and rejection on the 1D MA200 (orange trend-line) on August 12. Within the 9-month Bearish Channel, this has been the 2nd 1D MA200 rejection, with the first (April 02) causing a -77% correction.
This time however there's reason to believe that the bearish trend will break as not only is the MACD on the 1W time-frame on a confirmed Bullish Cross since August 04, but the 1D RSI is on Higher Lows since May 12. Ankr is also on a Double Bottom since June 18.
However the April rejection also had an initial rebound on the short-term, which however failed to break above the 0.618 Fibonacci. In order to claim that we won't get a new sell-off this time, the price needs to break above this short-term Resistance, which could happen to be at the same time as a new 1D MA200 test.
Technically, a break above the 1W MA50 (red trend-line) confirms the trend shift from bearish to bullish on the long-term.
--------------------------------------------------------------------------------------------------------
** Please support this idea with your likes and comments, it is the best way to keep it relevant and support me. **
--------------------------------------------------------------------------------------------------------
This time however there's reason to believe that the bearish trend will break as not only is the MACD on the 1W time-frame on a confirmed Bullish Cross since August 04, but the 1D RSI is on Higher Lows since May 12. Ankr is also on a Double Bottom since June 18.
However the April rejection also had an initial rebound on the short-term, which however failed to break above the 0.618 Fibonacci. In order to claim that we won't get a new sell-off this time, the price needs to break above this short-term Resistance, which could happen to be at the same time as a new 1D MA200 test.
Technically, a break above the 1W MA50 (red trend-line) confirms the trend shift from bearish to bullish on the long-term.
--------------------------------------------------------------------------------------------------------
** Please support this idea with your likes and comments, it is the best way to keep it relevant and support me. **
--------------------------------------------------------------------------------------------------------

I trade Crypto, Forex, Indices & Commodities on PrimeXBT — all from one account with TradingView charts 👉 tradingshot.short.gy/PrimeXBT
I also use TradeNation for fixed spreads & zero commission 👉 tradingshot.short.gy/Tradenation
I also use TradeNation for fixed spreads & zero commission 👉 tradingshot.short.gy/Tradenation
면책사항
해당 정보와 게시물은 금융, 투자, 트레이딩 또는 기타 유형의 조언이나 권장 사항으로 간주되지 않으며, 트레이딩뷰에서 제공하거나 보증하는 것이 아닙니다. 자세한 내용은 이용 약관을 참조하세요.
I trade Crypto, Forex, Indices & Commodities on PrimeXBT — all from one account with TradingView charts 👉 tradingshot.short.gy/PrimeXBT
I also use TradeNation for fixed spreads & zero commission 👉 tradingshot.short.gy/Tradenation
I also use TradeNation for fixed spreads & zero commission 👉 tradingshot.short.gy/Tradenation
면책사항
해당 정보와 게시물은 금융, 투자, 트레이딩 또는 기타 유형의 조언이나 권장 사항으로 간주되지 않으며, 트레이딩뷰에서 제공하거나 보증하는 것이 아닙니다. 자세한 내용은 이용 약관을 참조하세요.