업데이트됨
APHA Rising Wedge on Hourly Uptrend
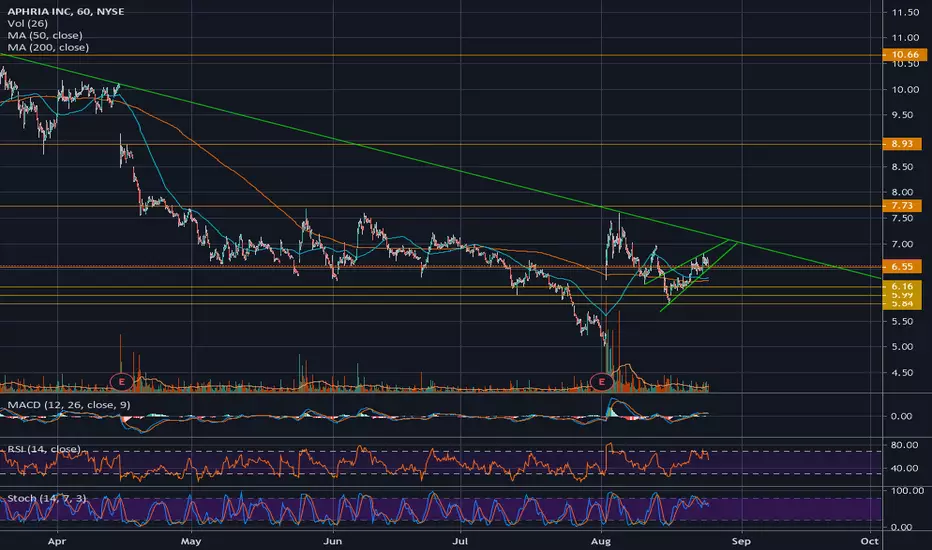
Rising wedge pattern on the hourly chart. Daily indicators show possible underlying strength, but hourly volume is decreasing. Broader markets could see a bounce on Monday, and APHA is likely to participate, but chances are very small that it'll break this pattern bullish.
Trade with caution.
Trade with caution.
노트
As expected, a bearish confirmation of this rising wedge pattern. Now we are looking at a descending triangle on the daily charts, another bearish pattern, indicating that APHA may want to close the bull gap before reaching for new highs. It makes sense, to expect buyers to wait there, patiently. Seems like a great level to get in for a long position - $5.20ish.노트
Correction - $5.40ish
🅱🄰🆁🅺🆆🄾🆁🆃🅷
theBarkworthyNotes.com
theBarkworthyNotes.com
면책사항
해당 정보와 게시물은 금융, 투자, 트레이딩 또는 기타 유형의 조언이나 권장 사항으로 간주되지 않으며, 트레이딩뷰에서 제공하거나 보증하는 것이 아닙니다. 자세한 내용은 이용 약관을 참조하세요.
🅱🄰🆁🅺🆆🄾🆁🆃🅷
theBarkworthyNotes.com
theBarkworthyNotes.com
면책사항
해당 정보와 게시물은 금융, 투자, 트레이딩 또는 기타 유형의 조언이나 권장 사항으로 간주되지 않으며, 트레이딩뷰에서 제공하거나 보증하는 것이 아닙니다. 자세한 내용은 이용 약관을 참조하세요.