
 APTUSDT (
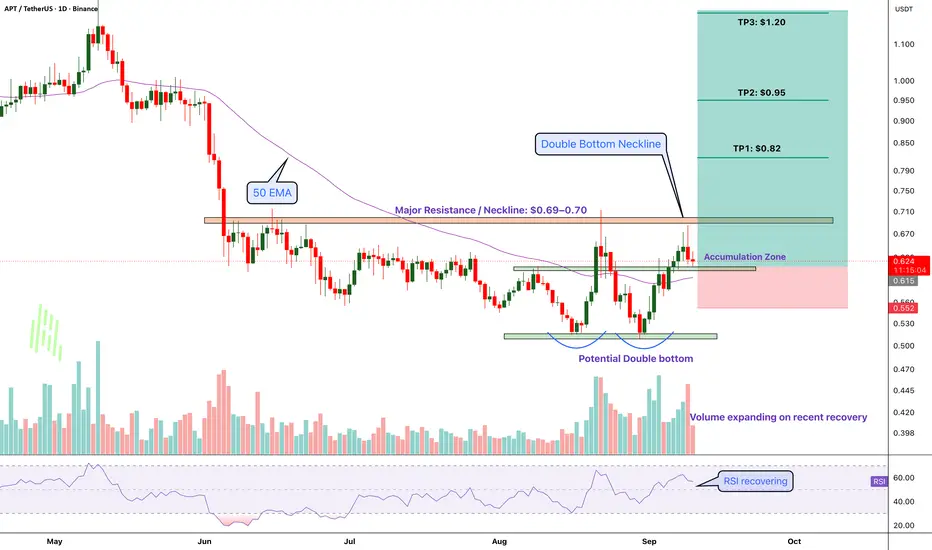
 APTOS) has been pretty much forgotten for a while.After the long sell-off, though, the chart is starting to show a different picture. Price has built a base around the $0.50–$0.52 area and we’re now seeing a recovery back toward the key resistance zone.The level that matters most to me is $0.69–$0.70.That’s the neckline of the potential double bottom. A clean daily break and hold above this area would be the first real confirmation that the bigger trend may be changing.
There are a few things lining up here:
* Potential double bottom around major support
* Price recovering around the 50 EMA
* Volume picking up during the recovery
* RSI turning higher
My levels:
Accumulation: $0.60–$0.63
Invalidation: $0.55
TP1: $0.82
TP2: $0.95
TP3: $1.20
I’m not chasing
 APT here. I’m more interested in what happens around $0.69–$0.70.
Break and hold it → the reversal gets interesting.
Reject it → we may need to wait longer.
Either way, this is one of those charts I’ll be watching closely over the next few weeks.
Follow Our Tradingview Account for More Technical Analysis Updates, | Like, Share and Comment Your thoughts

📢 Telegram Channel: t.me/getgreencrypto
🆓 Free Trial / Contact Us: t.me/greencryptosupport
🌐 Website: greencrypto.net
📚 Docs: docs.greencrypto.net
🆓 Free Trial / Contact Us: t.me/greencryptosupport
🌐 Website: greencrypto.net
📚 Docs: docs.greencrypto.net
관련 발행물
면책사항
해당 정보와 게시물은 금융, 투자, 트레이딩 또는 기타 유형의 조언이나 권장 사항으로 간주되지 않으며, 트레이딩뷰에서 제공하거나 보증하는 것이 아닙니다. 자세한 내용은 이용 약관을 참조하세요.
📢 Telegram Channel: t.me/getgreencrypto
🆓 Free Trial / Contact Us: t.me/greencryptosupport
🌐 Website: greencrypto.net
📚 Docs: docs.greencrypto.net
🆓 Free Trial / Contact Us: t.me/greencryptosupport
🌐 Website: greencrypto.net
📚 Docs: docs.greencrypto.net
관련 발행물
면책사항
해당 정보와 게시물은 금융, 투자, 트레이딩 또는 기타 유형의 조언이나 권장 사항으로 간주되지 않으며, 트레이딩뷰에서 제공하거나 보증하는 것이 아닙니다. 자세한 내용은 이용 약관을 참조하세요.