
APTUSDT technical analysis update
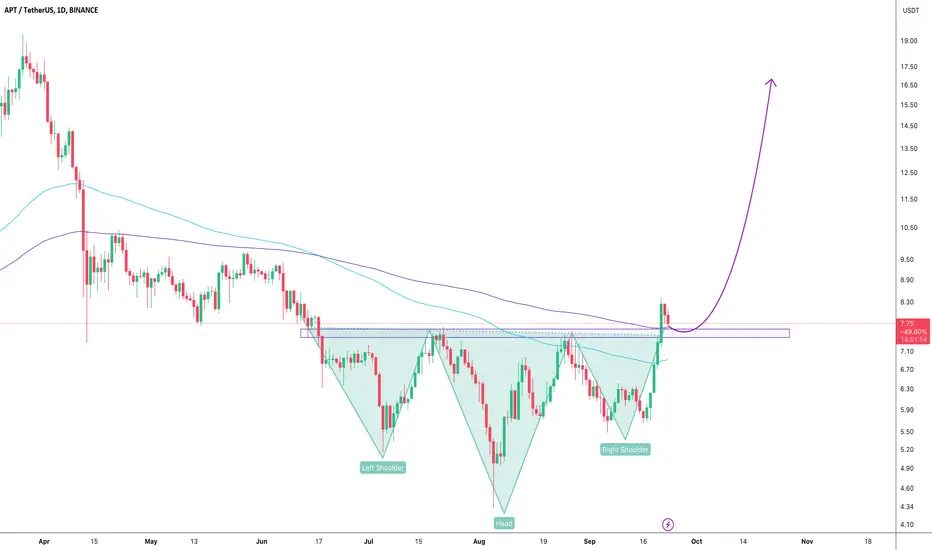
APT has formed an inverse head and shoulders pattern on the daily chart. The price has broken the neckline and is now retesting it as support. Additionally, the price is trading above the 100 and 200 EMAs on the daily chart. A strong bullish move is expected in the coming days.
Regards
Hexa
APT has formed an inverse head and shoulders pattern on the daily chart. The price has broken the neckline and is now retesting it as support. Additionally, the price is trading above the 100 and 200 EMAs on the daily chart. A strong bullish move is expected in the coming days.
Regards
Hexa
거래청산: 타겟 닿음
APTUSDT 35%+ gain
🚀Telegram : t.me/hexatrades
🌐Website: hexatrades.io/
🗣️Twitter(X): twitter.com/HexaTrades
🌐Website: hexatrades.io/
🗣️Twitter(X): twitter.com/HexaTrades
관련 발행물
면책사항
해당 정보와 게시물은 금융, 투자, 트레이딩 또는 기타 유형의 조언이나 권장 사항으로 간주되지 않으며, 트레이딩뷰에서 제공하거나 보증하는 것이 아닙니다. 자세한 내용은 이용 약관을 참조하세요.
🚀Telegram : t.me/hexatrades
🌐Website: hexatrades.io/
🗣️Twitter(X): twitter.com/HexaTrades
🌐Website: hexatrades.io/
🗣️Twitter(X): twitter.com/HexaTrades
관련 발행물
면책사항
해당 정보와 게시물은 금융, 투자, 트레이딩 또는 기타 유형의 조언이나 권장 사항으로 간주되지 않으며, 트레이딩뷰에서 제공하거나 보증하는 것이 아닙니다. 자세한 내용은 이용 약관을 참조하세요.