
On the weekly chart, ARIA has two unfilled Fair Value Gaps (FVGs) sitting around the 0.10 area and below, aligning with the 0.618 Fib retracement — a key potential draw-on-liquidity zone if price revisits deeper levels later in the cycle.
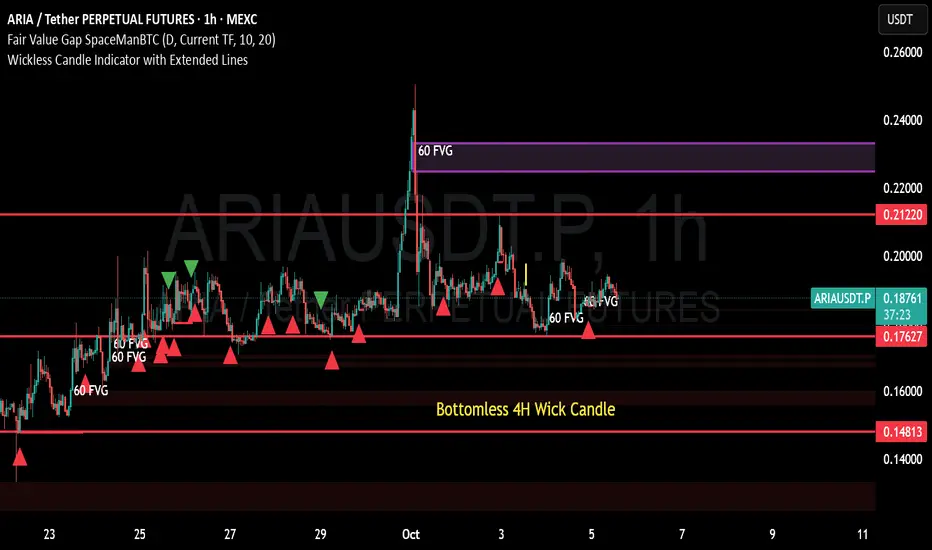
On the 4-hour timeframe, structure remains reactive, with a clean FVG above price between 0.224–0.234, acting as an immediate upside magnet.
The 1-hour and 30-minute charts confirm this same gap, showing confluence that price may want to tap into before deciding direction.
Short-term charts (15m, 5m, and 1m) reveal a sequence of smaller FVGs leading up to a final one at 0.2402–0.2444, suggesting a possible liquidity sweep before any retracement.
Watching for signs of exhaustion near that zone could give a high-probability short setup or partial take-profit area for longs.
📊 Key zones:
1H/4H FVG above: 0.224–0.234
Short-term FVG clusters: 0.240–0.244
Weekly FVGs below: ~0.10 area (longer-term retrace zone)
On the 4-hour timeframe, structure remains reactive, with a clean FVG above price between 0.224–0.234, acting as an immediate upside magnet.
The 1-hour and 30-minute charts confirm this same gap, showing confluence that price may want to tap into before deciding direction.
Short-term charts (15m, 5m, and 1m) reveal a sequence of smaller FVGs leading up to a final one at 0.2402–0.2444, suggesting a possible liquidity sweep before any retracement.
Watching for signs of exhaustion near that zone could give a high-probability short setup or partial take-profit area for longs.
📊 Key zones:
1H/4H FVG above: 0.224–0.234
Short-term FVG clusters: 0.240–0.244
Weekly FVGs below: ~0.10 area (longer-term retrace zone)

면책사항
해당 정보와 게시물은 금융, 투자, 트레이딩 또는 기타 유형의 조언이나 권장 사항으로 간주되지 않으며, 트레이딩뷰에서 제공하거나 보증하는 것이 아닙니다. 자세한 내용은 이용 약관을 참조하세요.
면책사항
해당 정보와 게시물은 금융, 투자, 트레이딩 또는 기타 유형의 조언이나 권장 사항으로 간주되지 않으며, 트레이딩뷰에서 제공하거나 보증하는 것이 아닙니다. 자세한 내용은 이용 약관을 참조하세요.