
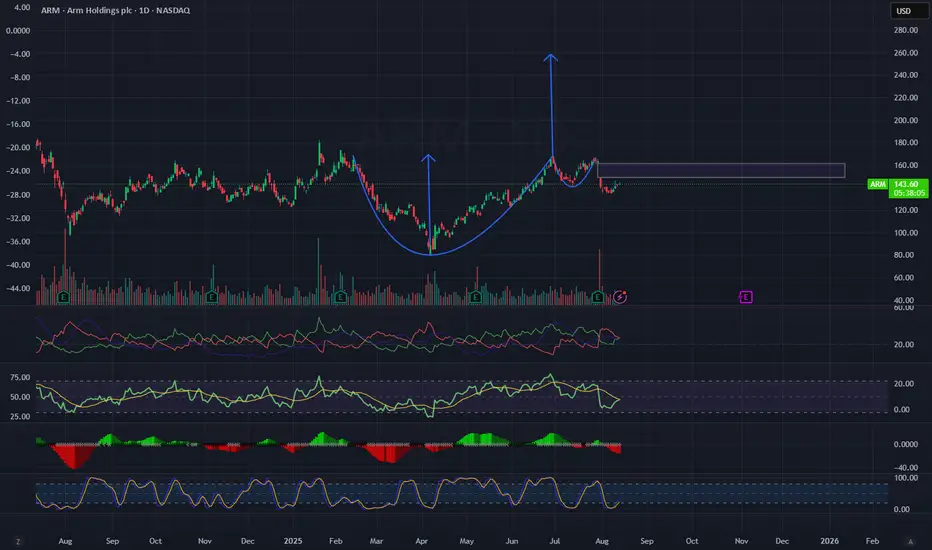
On ARM’s daily chart, we can see a clear Cup & Handle pattern – twice in a row – with strong upward moves following each completion.
The latest pattern completed around the $165 area, after which the stock pulled back into a healthy correction and is now consolidating in the $140–$150 range.
Technical Analysis:
Indicators:
Trade Plan:
Summary:
ARM is showing a classic bullish setup with a strong potential for another upward move. A breakout of the key resistance levels with strong volume could trigger a sharp rally, similar to the previous two bullish waves.
The latest pattern completed around the $165 area, after which the stock pulled back into a healthy correction and is now consolidating in the $140–$150 range.
Technical Analysis:
- Pattern: Cup & Handle with a small pullback, indicating potential re-accumulation.
- Key Support: $140 (a breakdown below would weaken the setup).
- Key Resistance: $150–$155 (a confirmed breakout above could trigger the next bullish leg).
Indicators:
- RSI near 50 – neutral, room to move higher.
- MACD in a correction phase but close to a potential bullish cross.
- ADX showing temporary trend weakness but could strengthen after a breakout.
- Stochastic slightly in overbought territory but not extreme.
- Volume: Decreasing volume during the pullback – a healthy sign for a potential upward breakout.
Trade Plan:
- Entry: On a confirmed breakout above $155 with higher-than-average volume.
- Target 1: $165 (previous resistance).
- Target 2: $180–$185 (depending on momentum strength).
- Stop Loss: Daily close below $140.
Summary:
ARM is showing a classic bullish setup with a strong potential for another upward move. A breakout of the key resistance levels with strong volume could trigger a sharp rally, similar to the previous two bullish waves.

면책사항
해당 정보와 게시물은 금융, 투자, 트레이딩 또는 기타 유형의 조언이나 권장 사항으로 간주되지 않으며, 트레이딩뷰에서 제공하거나 보증하는 것이 아닙니다. 자세한 내용은 이용 약관을 참조하세요.
면책사항
해당 정보와 게시물은 금융, 투자, 트레이딩 또는 기타 유형의 조언이나 권장 사항으로 간주되지 않으며, 트레이딩뷰에서 제공하거나 보증하는 것이 아닙니다. 자세한 내용은 이용 약관을 참조하세요.