
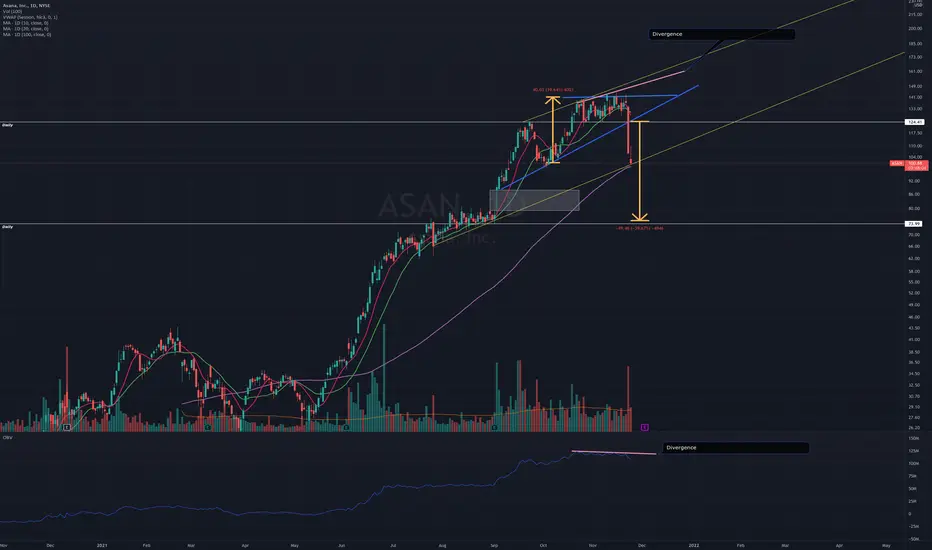
Bearish setup on daily chart. Let me know what you all see.
ASAN Short - Bearish setup
* MA 20/10 crossover
* Ascending triangle breakdown on high volume
* Bearish Divergence on OBV indicator
- Potential area to analyze
Break of trendline support which would also be a confluence area for MA100
Entry - Im thinking the closed below Trendline $98-99
Profit area - Test of gap or gap fill ($ 87 - 79) or implied move of pattern $74.
ASAN Short - Bearish setup
* MA 20/10 crossover
* Ascending triangle breakdown on high volume
* Bearish Divergence on OBV indicator
- Potential area to analyze
Break of trendline support which would also be a confluence area for MA100
Entry - Im thinking the closed below Trendline $98-99
Profit area - Test of gap or gap fill ($ 87 - 79) or implied move of pattern $74.

면책사항
해당 정보와 게시물은 금융, 투자, 트레이딩 또는 기타 유형의 조언이나 권장 사항으로 간주되지 않으며, 트레이딩뷰에서 제공하거나 보증하는 것이 아닙니다. 자세한 내용은 이용 약관을 참조하세요.
면책사항
해당 정보와 게시물은 금융, 투자, 트레이딩 또는 기타 유형의 조언이나 권장 사항으로 간주되지 않으며, 트레이딩뷰에서 제공하거나 보증하는 것이 아닙니다. 자세한 내용은 이용 약관을 참조하세요.