
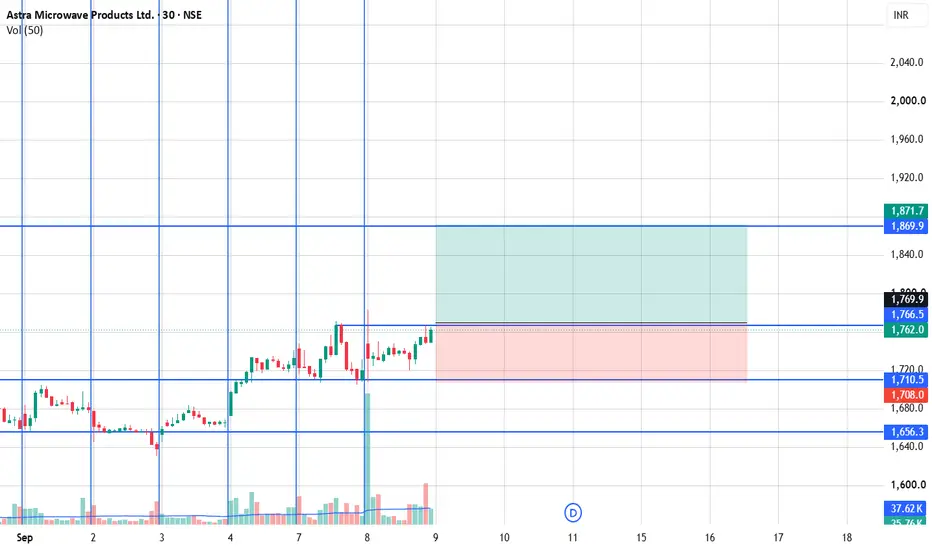
This is Astra Microwave – 30-minute chart. I’ll explain the Buy/Sell setup
Current situation on your chart
Current price is around ₹1,762, so it is sitting between ₹1,710 support and ₹1,870 resistance.
That means the chart is currently in a range, rather than giving a clean breakout/breakdown signal.
Simple rule:
Below ₹1,710 → bearish structure
₹1,710–₹1,870 → range / wait for confirmation
Above ₹1,870 → bullish breakout structure

면책사항
해당 정보와 게시물은 금융, 투자, 트레이딩 또는 기타 유형의 조언이나 권장 사항으로 간주되지 않으며, 트레이딩뷰에서 제공하거나 보증하는 것이 아닙니다. 자세한 내용은 이용 약관을 참조하세요.
면책사항
해당 정보와 게시물은 금융, 투자, 트레이딩 또는 기타 유형의 조언이나 권장 사항으로 간주되지 않으며, 트레이딩뷰에서 제공하거나 보증하는 것이 아닙니다. 자세한 내용은 이용 약관을 참조하세요.