
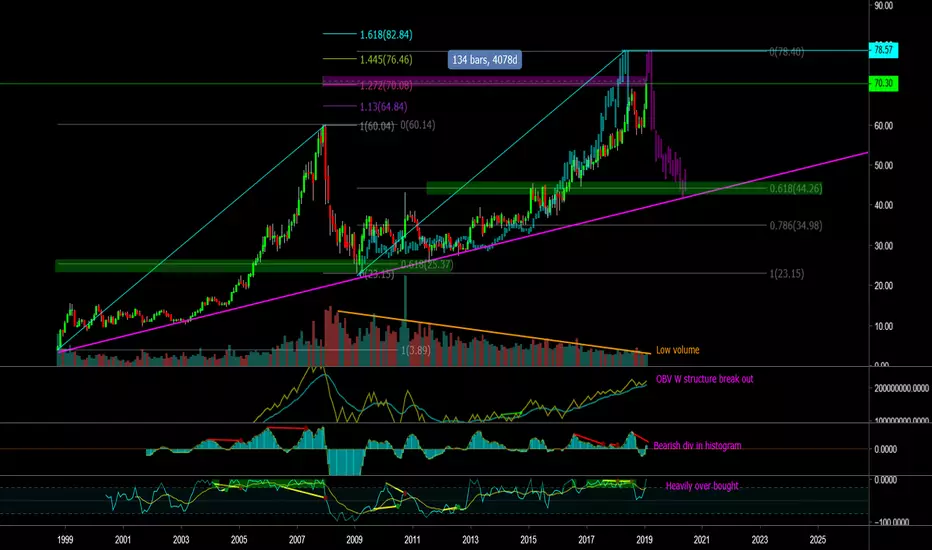
Looking at the ASX on the monthly chart
Seems like a never ending 10 year bull market
*Years calculated since last retrace in 2008 to current 2019 is 11 years. We are coming to the end of another 10 year market cycle (or GFC)
*I've added an AB=CD (in blue) to price to project where D will end. I've also cloned price for a better visual.
*Target objective is showing to hit the 1.445 fib extension
*I've cloned the 2008 GFC pull back and added it to the top of price for a projection of where price may pull back to.
*The fibs from A to B retracement hit the 618 fib and with the clone setup from C to D also fit the 618 retracement which also happens to ling up perfectly with the trend line.
*Volume has dropped off significantly
*OBV has created a W indicating price wants to go higher
*Bearish divergence in the Histogram
*Will is embedded and stupidly over bought
*RSI is also showing bearish divergence
*VPVR is also showing that its in single ticks
*The 200ma is also sitting around the POC of VPVR at $35
*With a GFC inevitably lurking around its only a matter of time before this bull comes to an end.
* Don't forget to hit that like button and follow me on Trading View for more chart analysis :)
Seems like a never ending 10 year bull market
*Years calculated since last retrace in 2008 to current 2019 is 11 years. We are coming to the end of another 10 year market cycle (or GFC)
*I've added an AB=CD (in blue) to price to project where D will end. I've also cloned price for a better visual.
*Target objective is showing to hit the 1.445 fib extension
*I've cloned the 2008 GFC pull back and added it to the top of price for a projection of where price may pull back to.
*The fibs from A to B retracement hit the 618 fib and with the clone setup from C to D also fit the 618 retracement which also happens to ling up perfectly with the trend line.
*Volume has dropped off significantly
*OBV has created a W indicating price wants to go higher
*Bearish divergence in the Histogram
*Will is embedded and stupidly over bought
*RSI is also showing bearish divergence
*VPVR is also showing that its in single ticks
*The 200ma is also sitting around the POC of VPVR at $35
*With a GFC inevitably lurking around its only a matter of time before this bull comes to an end.
* Don't forget to hit that like button and follow me on Trading View for more chart analysis :)

면책사항
해당 정보와 게시물은 금융, 투자, 트레이딩 또는 기타 유형의 조언이나 권장 사항으로 간주되지 않으며, 트레이딩뷰에서 제공하거나 보증하는 것이 아닙니다. 자세한 내용은 이용 약관을 참조하세요.
면책사항
해당 정보와 게시물은 금융, 투자, 트레이딩 또는 기타 유형의 조언이나 권장 사항으로 간주되지 않으며, 트레이딩뷰에서 제공하거나 보증하는 것이 아닙니다. 자세한 내용은 이용 약관을 참조하세요.