
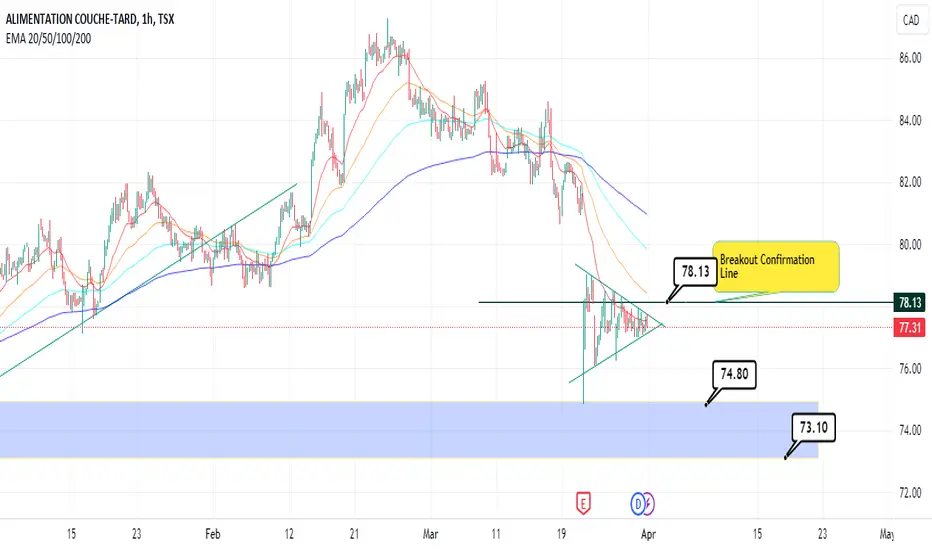
There’s a clear symmetric triangle nearing a breakout and it can go any side as this pattern typically indicates a period of consolidation, with the price breakout direction being uncertain.
In case of a bearish breakout, there’s a strong support zone between $74 and $73. I’d suggest you to wait until the price breaks out above the red EMA 20 line on this hourly chart.
In case of a bearish breakout, there’s a strong support zone between $74 and $73. I’d suggest you to wait until the price breaks out above the red EMA 20 line on this hourly chart.

면책사항
해당 정보와 게시물은 금융, 투자, 트레이딩 또는 기타 유형의 조언이나 권장 사항으로 간주되지 않으며, 트레이딩뷰에서 제공하거나 보증하는 것이 아닙니다. 자세한 내용은 이용 약관을 참조하세요.
면책사항
해당 정보와 게시물은 금융, 투자, 트레이딩 또는 기타 유형의 조언이나 권장 사항으로 간주되지 않으며, 트레이딩뷰에서 제공하거나 보증하는 것이 아닙니다. 자세한 내용은 이용 약관을 참조하세요.