
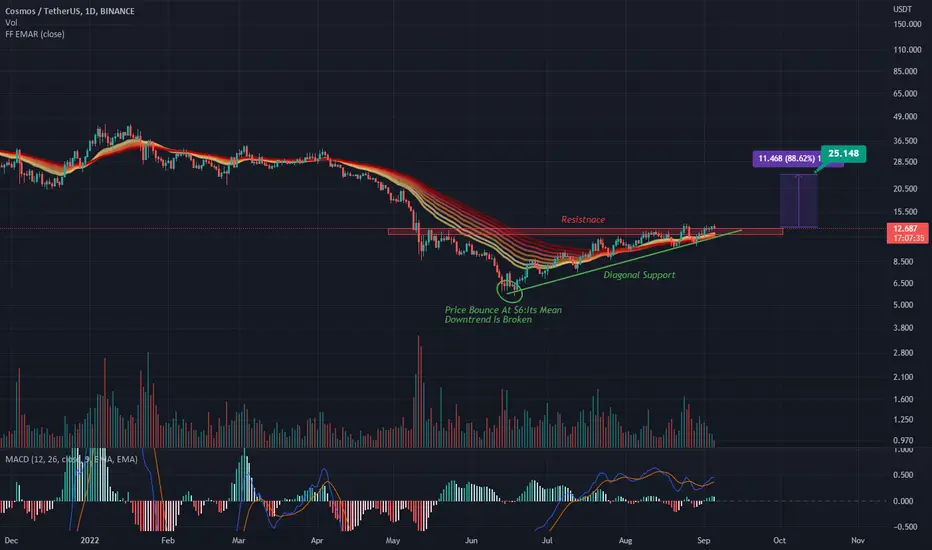
Hello everyone, today i'm going analysis ATOM/USDT on Daily time frame.
1)First we can clearly see ATOM strong Bounce from $6 to $12, its mean Downtrend is broken and now we are Uptrend cycle.
2)In chart we formed Ascending Triangle pattern,we have diagonal Support line and horizontal Resistance level at $12 approximately.
3)Now price squeezing in Ascending Triangle and price can breakout from $12 at any moment,so for clear breakout price must close behind Ascending Triangle approximately at $15 with good Volume.
4)We also will using Ribbon trend indicator,we can clearly see price above Ribbon line its mean we are now in momentum.
5)MACD oscillator is above Histogram 0 line its Bullish and also we have Bullish cross.
i'm will happy if this analysis will help you

면책사항
해당 정보와 게시물은 금융, 투자, 트레이딩 또는 기타 유형의 조언이나 권장 사항으로 간주되지 않으며, 트레이딩뷰에서 제공하거나 보증하는 것이 아닙니다. 자세한 내용은 이용 약관을 참조하세요.
면책사항
해당 정보와 게시물은 금융, 투자, 트레이딩 또는 기타 유형의 조언이나 권장 사항으로 간주되지 않으며, 트레이딩뷰에서 제공하거나 보증하는 것이 아닙니다. 자세한 내용은 이용 약관을 참조하세요.