

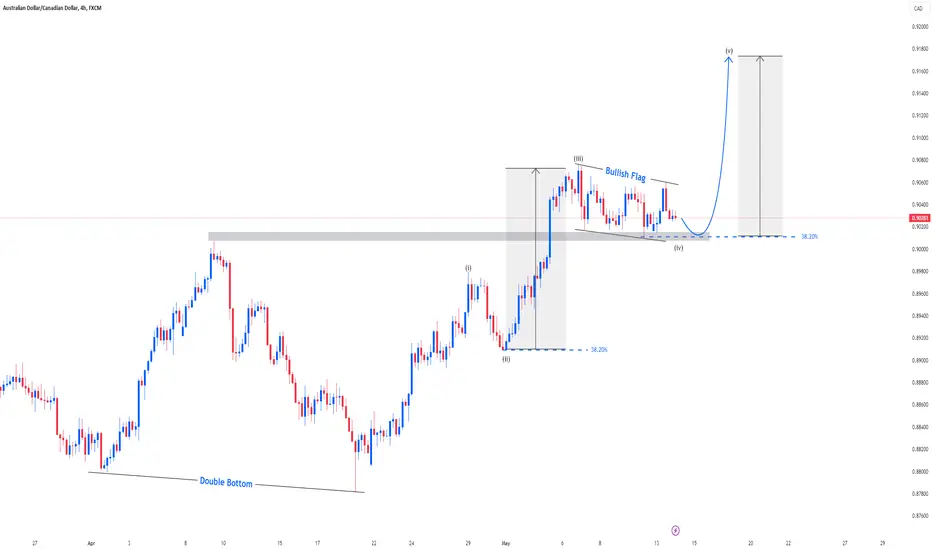
Based on the bullish flag pattern and Elliott Wave analysis on the AUD/CAD pair's 4-hour timeframe, there seems to be a potential opportunity for a buying position. The bullish flag suggests a continuation of the previous uptrend, while the Elliott Wave count indicates the formation of the 12345 impulse wave sequence. This convergence of patterns could signal a strong upward movement in price, presenting a favorable entry point for buyers. However, it's crucial to implement proper risk management strategies and confirm signals with additional indicators before entering the trade.

면책사항
해당 정보와 게시물은 금융, 투자, 트레이딩 또는 기타 유형의 조언이나 권장 사항으로 간주되지 않으며, 트레이딩뷰에서 제공하거나 보증하는 것이 아닙니다. 자세한 내용은 이용 약관을 참조하세요.
면책사항
해당 정보와 게시물은 금융, 투자, 트레이딩 또는 기타 유형의 조언이나 권장 사항으로 간주되지 않으며, 트레이딩뷰에서 제공하거나 보증하는 것이 아닙니다. 자세한 내용은 이용 약관을 참조하세요.