

Monthly Time Frame

Weekly Time Frame

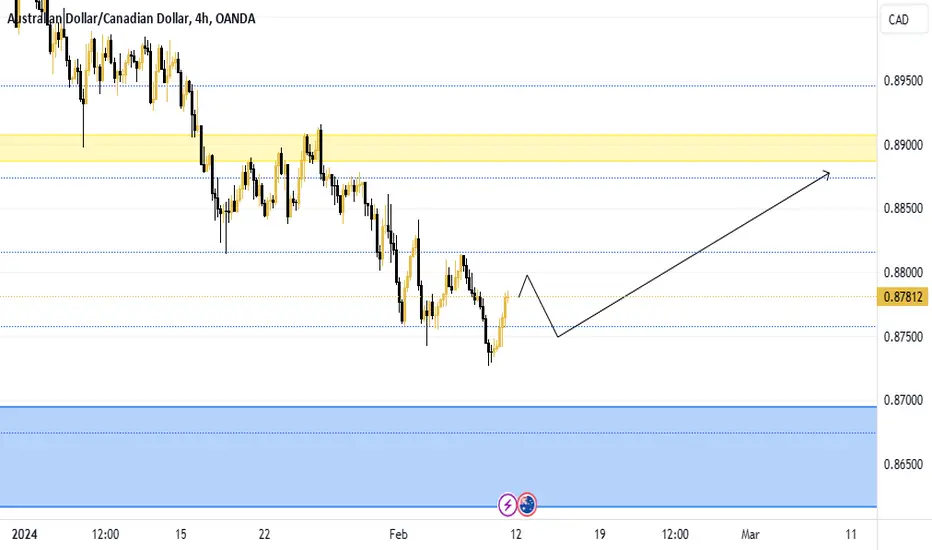
4Hour Time Frame

- Price made a bearish push until it closed as a doji candlestick found support at the weekly demand zone then made a bullish push
- After the bullish push price met resistance at a weekly supply zone ultimately forming a high. Price then began to sell off (retrace).
Weekly Time Frame
- Price met resistance, formed a double top, and closed as a doji followed by a bearish engulfing signaling a selloff.
- During the sell-off (retracement) price found support at the 61.8 fib level and closed as doji candle stick signaling a potential reversal.
4Hour Time Frame
- I am anticipating price forming a double bottom as a candlestick reversal pattern.
- I am expecting a bullish push to 0.895
노트
Price is beginning to make its bullish push as anticapted.
면책사항
해당 정보와 게시물은 금융, 투자, 트레이딩 또는 기타 유형의 조언이나 권장 사항으로 간주되지 않으며, 트레이딩뷰에서 제공하거나 보증하는 것이 아닙니다. 자세한 내용은 이용 약관을 참조하세요.
면책사항
해당 정보와 게시물은 금융, 투자, 트레이딩 또는 기타 유형의 조언이나 권장 사항으로 간주되지 않으며, 트레이딩뷰에서 제공하거나 보증하는 것이 아닙니다. 자세한 내용은 이용 약관을 참조하세요.