

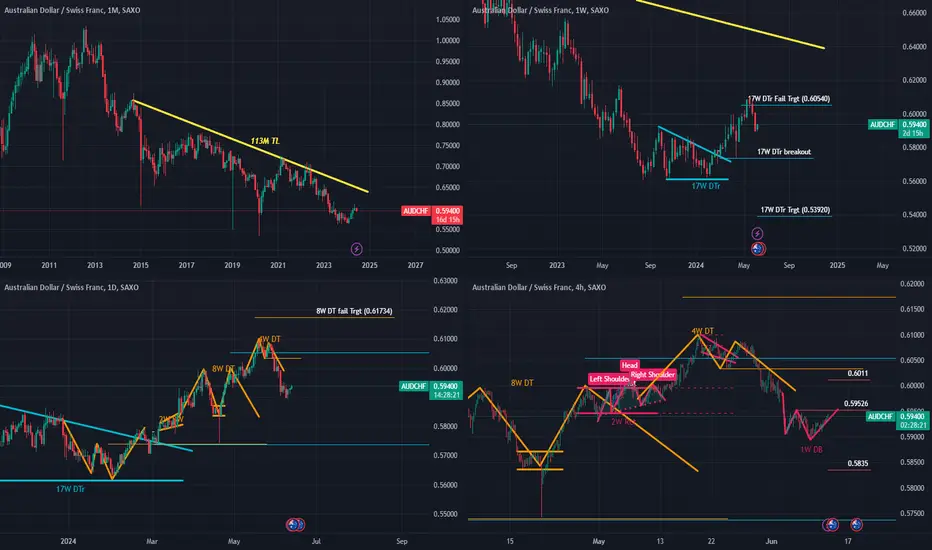
Idea based on Classical chart patterns on a short time frame(4H chart).
abbreviations:
M/W/D/H = Month/Week/Day/Hour
TL: Trendline
DT: Double Top
DTr: Descending Triangle
The chart goes from Monthly(top left)/Weekly(top right)/Daily(bottom left)/4 Hours(bottom right)
1st from the monthly chart you can see the pair in a steady down trend, and maybe one could say that it is sitting at the low ends of the down trend.
zoom into the weekly chart and you see that indeed there was a DTr that took 17W to form indicating a break lower, which never happened. A failure of this pattern led to a move to the target derived from the pattern @0.6055 level. the market now hit the target. And the heat seems to be waning.
in the daily chart, near the 17W DTr failure target the market has now attempted to form patterns indicating topping out of the moves, 8W DT and 4WDT. While the former turned out to be a failed pattern, the former, at least for now, seems like a pattern completion.
all this in mind, the 4H chart now seems to be forming a 1W DB, which could mean that the market is still strong, and the bullish move may continue, or this is a failed attempt to consolidate and the trend turns.
based on the target derived from the 1W DB, the risk return looks more favor for a short AUDCHF, looking for almost 7:1 risk reward trade.
Entry : 0.5938 or above
SL : 0.5953 (-0.25%) / TP: 0.5835(+1.7%)
(as always, not investment advise or prediction)
거래청산: 스탑 닿음
Post CPI risk rally took out the stop. how ever no clear breakout to the upside yet. may think of a second try downside. if there is no breach of the highs after CPI노트
reentry of a double bottom fail.SL: 0.5986 , TP : 0.5835 RR: roughly 3:1
액티브 트레이드
2nd attempt is now in the money, stop loss moved to breakeven. lets see how it goes.액티브 트레이드
Took half the position off as it reached +1% vs equity.leaving the rest of the position to run as much as it can.
매매 수동청산
tightened stop hit at 0.5902.1st trade = -0.20% loss
2nd trad = +1.00% profit
Net profit of +0.80% of total equity.

면책사항
해당 정보와 게시물은 금융, 투자, 트레이딩 또는 기타 유형의 조언이나 권장 사항으로 간주되지 않으며, 트레이딩뷰에서 제공하거나 보증하는 것이 아닙니다. 자세한 내용은 이용 약관을 참조하세요.
면책사항
해당 정보와 게시물은 금융, 투자, 트레이딩 또는 기타 유형의 조언이나 권장 사항으로 간주되지 않으며, 트레이딩뷰에서 제공하거나 보증하는 것이 아닙니다. 자세한 내용은 이용 약관을 참조하세요.