

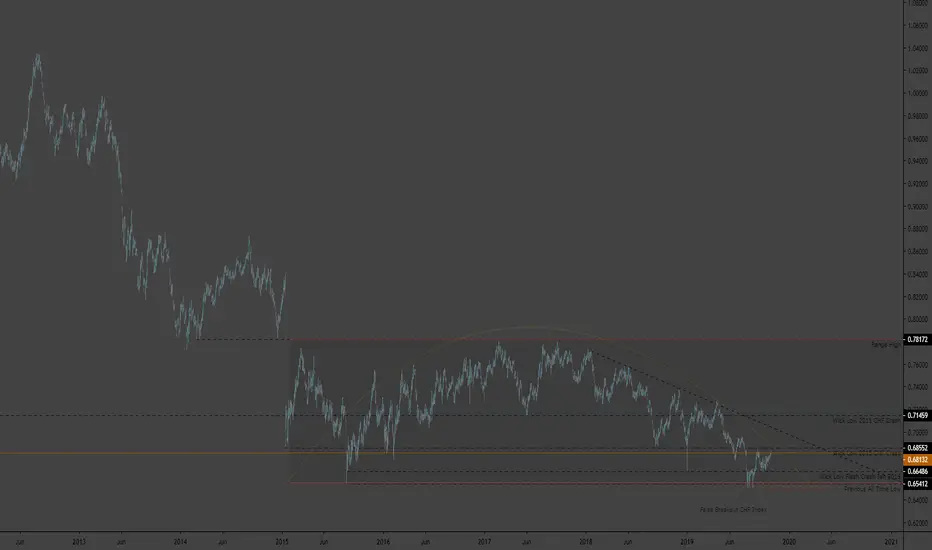
AUDCHF approaching resistance on the daily chart. Some key support resistance levels marked on the chart.
This pair has been in downtrend since September 2018.
The pair took a quick look below the previous all time low from back in 2015, which created a false break out.
The lower wick from 2015 flash crash looks to be holding as resistance.
1 hour chart looks like we just broke below support.
This pair has been in downtrend since September 2018.
The pair took a quick look below the previous all time low from back in 2015, which created a false break out.
The lower wick from 2015 flash crash looks to be holding as resistance.
1 hour chart looks like we just broke below support.
노트
Close up view of 1 hour chart
면책사항
해당 정보와 게시물은 금융, 투자, 트레이딩 또는 기타 유형의 조언이나 권장 사항으로 간주되지 않으며, 트레이딩뷰에서 제공하거나 보증하는 것이 아닙니다. 자세한 내용은 이용 약관을 참조하세요.
면책사항
해당 정보와 게시물은 금융, 투자, 트레이딩 또는 기타 유형의 조언이나 권장 사항으로 간주되지 않으며, 트레이딩뷰에서 제공하거나 보증하는 것이 아닙니다. 자세한 내용은 이용 약관을 참조하세요.