

Monthly/Weekly
Daily
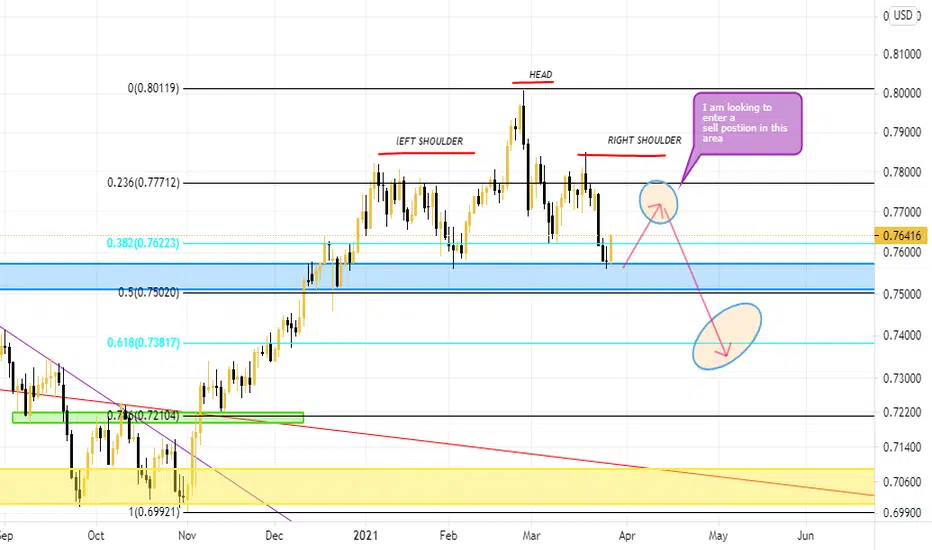
*Price has formed a Head and Shoulders (H&S) formation which is a sign of bearish pressure or a possible move to the downside.
Remember on the higher timeframe, price has been consolidating, the H&S formation on the daily is a confirmation that price is ready to drop.
I am expecting price to make one more attempt to the upside before making the bearish move to the downside.
If you draw a Fibonacci from the beginning of the right shoulder to the blue support level where price reversed, you will notice that I am expecting price to make a final push near the 50.0-61.8 fib levels, which correlates with the area arrows I drew.
Here is where I'm expecting to enter a sell position.
- -Price is clearly in an overall bullish trend.
- But price appears to have become overextended, after a huge breakout (through the trend line) and has since been consolidating preparing to make a possible pullback/retracement.
Daily
*Price has formed a Head and Shoulders (H&S) formation which is a sign of bearish pressure or a possible move to the downside.
Remember on the higher timeframe, price has been consolidating, the H&S formation on the daily is a confirmation that price is ready to drop.
I am expecting price to make one more attempt to the upside before making the bearish move to the downside.
If you draw a Fibonacci from the beginning of the right shoulder to the blue support level where price reversed, you will notice that I am expecting price to make a final push near the 50.0-61.8 fib levels, which correlates with the area arrows I drew.
Here is where I'm expecting to enter a sell position.

면책사항
해당 정보와 게시물은 금융, 투자, 트레이딩 또는 기타 유형의 조언이나 권장 사항으로 간주되지 않으며, 트레이딩뷰에서 제공하거나 보증하는 것이 아닙니다. 자세한 내용은 이용 약관을 참조하세요.
면책사항
해당 정보와 게시물은 금융, 투자, 트레이딩 또는 기타 유형의 조언이나 권장 사항으로 간주되지 않으며, 트레이딩뷰에서 제공하거나 보증하는 것이 아닙니다. 자세한 내용은 이용 약관을 참조하세요.