

Continuation of previous post :
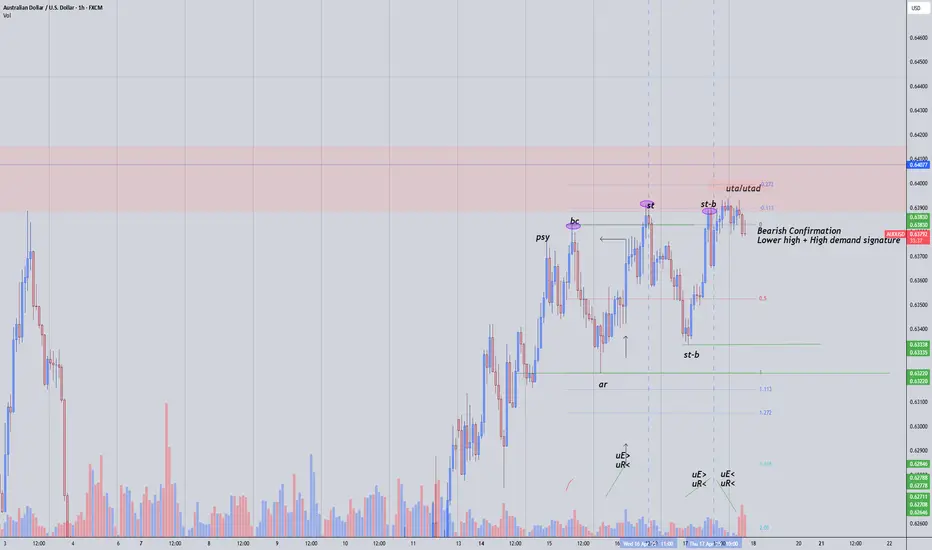
1H Range starts off this schematic by stopping the momentum at the point of the first secondary test, it fails to break the previous high and this markets goes from moving up to sideways into this TR. Each rally to previous highs reflects upside effort increasing, but upside result is decreasing indicating buyers weakness near this level. uE>, uR< = bearish indicator.
Favorable bearish confirmation would be a lower high, paired with high buy volume confirming the shift to bearish market.
1H Range starts off this schematic by stopping the momentum at the point of the first secondary test, it fails to break the previous high and this markets goes from moving up to sideways into this TR. Each rally to previous highs reflects upside effort increasing, but upside result is decreasing indicating buyers weakness near this level. uE>, uR< = bearish indicator.
Favorable bearish confirmation would be a lower high, paired with high buy volume confirming the shift to bearish market.

면책사항
해당 정보와 게시물은 금융, 투자, 트레이딩 또는 기타 유형의 조언이나 권장 사항으로 간주되지 않으며, 트레이딩뷰에서 제공하거나 보증하는 것이 아닙니다. 자세한 내용은 이용 약관을 참조하세요.
면책사항
해당 정보와 게시물은 금융, 투자, 트레이딩 또는 기타 유형의 조언이나 권장 사항으로 간주되지 않으며, 트레이딩뷰에서 제공하거나 보증하는 것이 아닙니다. 자세한 내용은 이용 약관을 참조하세요.