

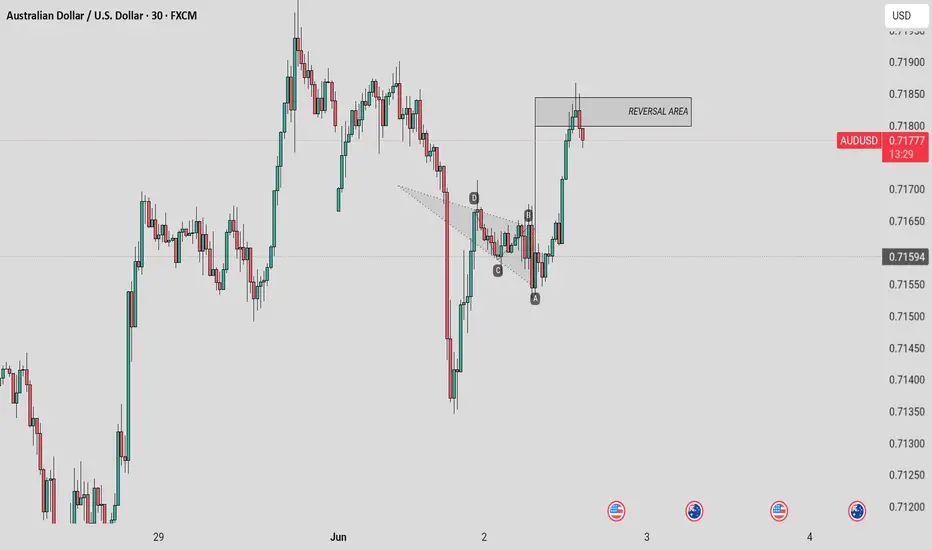
1. Harmonic Pattern: The chart illustrates a harmonic pattern characterized by points labeled A, B, C, and D. These points indicate a specific price movement structure that traders often use to identify potential reversal zones in the market.
2. Price Action: Following point D of the harmonic pattern, the price has begun to move upwards, suggesting a bullish trend or potential upward momentum in the AUDUSD pair.
3. Reversal Area: A shaded rectangle is marked as the "REVERSAL AREA" around the 0.71800 level. This area is highlighted as a potential zone where the price may encounter resistance, indicating that traders might expect a reversal or pullback in the upward trend.
4. Technical Analysis: The chart reflects a technical analysis approach, utilizing patterns and price action to make trading decisions. Traders may use this information to enter or exit positions based on anticipated market behavior.
Overall, the chart serves as a tool for traders looking to analyze the AUDUSD currency pair's movements and identify potential trading opportunities based on established patterns and market dynamics.

면책사항
해당 정보와 게시물은 금융, 투자, 트레이딩 또는 기타 유형의 조언이나 권장 사항으로 간주되지 않으며, 트레이딩뷰에서 제공하거나 보증하는 것이 아닙니다. 자세한 내용은 이용 약관을 참조하세요.
면책사항
해당 정보와 게시물은 금융, 투자, 트레이딩 또는 기타 유형의 조언이나 권장 사항으로 간주되지 않으며, 트레이딩뷰에서 제공하거나 보증하는 것이 아닙니다. 자세한 내용은 이용 약관을 참조하세요.