

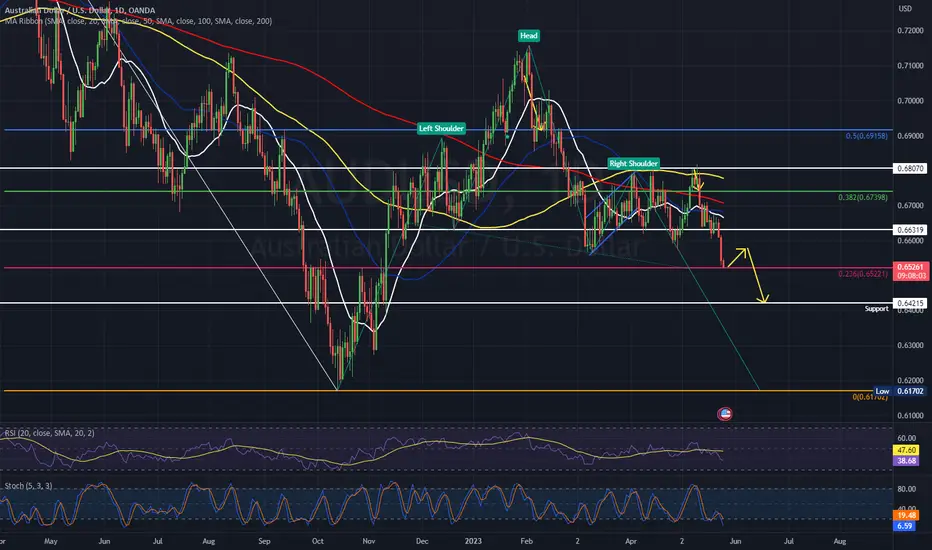
AUD/USD hit a six-month low at 0.6525, the broken neckline of the inverse head and shoulders pattern.
Technical indicators suggest further downward movement, with the RSI and Stochastic oscillator indicating oversold conditions. The MACD is negative, signaling a bearish trend.
The price has dropped below its moving averages and violated the short-term range floor at 0.6565. If sellers break the 0.6525 support, the pair may test the 61.8% Fibonacci retracement at 0.6483, followed by a decline towards 0.6420 and potentially the 0.6370-0.6340 zone.
Overall, AUD/USD is expected to see more selling if the 0.6525 level breaks.
Technical indicators suggest further downward movement, with the RSI and Stochastic oscillator indicating oversold conditions. The MACD is negative, signaling a bearish trend.
The price has dropped below its moving averages and violated the short-term range floor at 0.6565. If sellers break the 0.6525 support, the pair may test the 61.8% Fibonacci retracement at 0.6483, followed by a decline towards 0.6420 and potentially the 0.6370-0.6340 zone.
Overall, AUD/USD is expected to see more selling if the 0.6525 level breaks.
노트
AUD/USD following the path for now, it is time for early exits now. Scale your positions.

면책사항
해당 정보와 게시물은 금융, 투자, 트레이딩 또는 기타 유형의 조언이나 권장 사항으로 간주되지 않으며, 트레이딩뷰에서 제공하거나 보증하는 것이 아닙니다. 자세한 내용은 이용 약관을 참조하세요.
면책사항
해당 정보와 게시물은 금융, 투자, 트레이딩 또는 기타 유형의 조언이나 권장 사항으로 간주되지 않으며, 트레이딩뷰에서 제공하거나 보증하는 것이 아닙니다. 자세한 내용은 이용 약관을 참조하세요.