

HELLO TRADERS
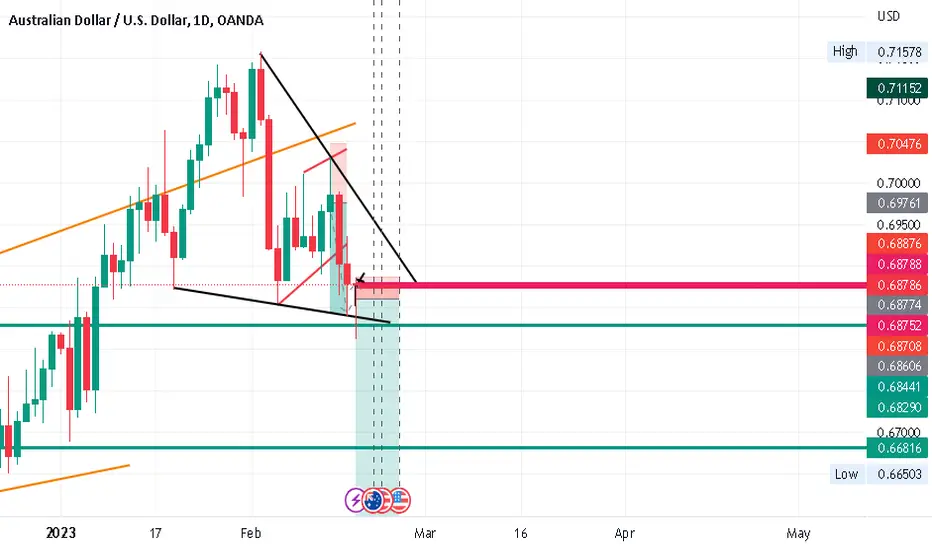
It seems like on a weekly timeframe this pair reached a resistance or supply zone(LOWER HIGH) and to back this up with top down analysis on a daily timeframe, the market formed a head and shoulders chart pattern which is a reversal chart pattern.
Moving on to the 4 Hour timeframe the market broke the neckline, probably confirming the new direction of the market.
Before any sell orders the market has to go through a correction phase to release buyers that are still in the market.
On the 1 Hour timeframe, traders should be vigilant for reversal candlestick pattern, chart pattern or Fibonacci retracement for entries......
N.B THIS ANALYSIS CAN ALSO BE USED ON CORRELATING PAIRS:
EURUSD
GBPUSD
NZDUSD
USDCHF
USDJPY
It seems like on a weekly timeframe this pair reached a resistance or supply zone(LOWER HIGH) and to back this up with top down analysis on a daily timeframe, the market formed a head and shoulders chart pattern which is a reversal chart pattern.
Moving on to the 4 Hour timeframe the market broke the neckline, probably confirming the new direction of the market.
Before any sell orders the market has to go through a correction phase to release buyers that are still in the market.
On the 1 Hour timeframe, traders should be vigilant for reversal candlestick pattern, chart pattern or Fibonacci retracement for entries......
N.B THIS ANALYSIS CAN ALSO BE USED ON CORRELATING PAIRS:
EURUSD
GBPUSD
NZDUSD
USDCHF
USDJPY

면책사항
해당 정보와 게시물은 금융, 투자, 트레이딩 또는 기타 유형의 조언이나 권장 사항으로 간주되지 않으며, 트레이딩뷰에서 제공하거나 보증하는 것이 아닙니다. 자세한 내용은 이용 약관을 참조하세요.
면책사항
해당 정보와 게시물은 금융, 투자, 트레이딩 또는 기타 유형의 조언이나 권장 사항으로 간주되지 않으며, 트레이딩뷰에서 제공하거나 보증하는 것이 아닙니다. 자세한 내용은 이용 약관을 참조하세요.