
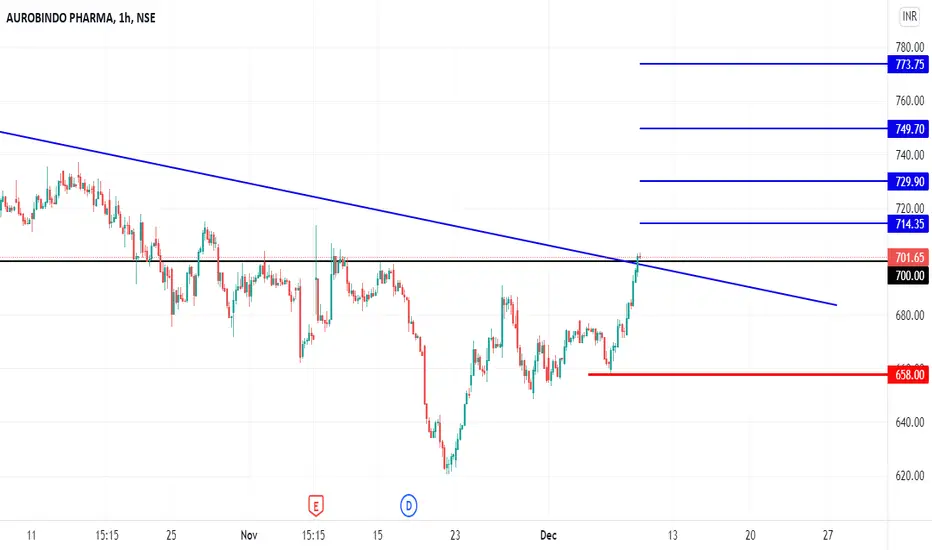
This stock has given good breakout of double resistance trendlines along with good intensity of volumes, all other indicators are also suggesting for upside, one can go long at current levels or in dips (if any) with mentioned stop loss and targets on chart.
wave structure could be like this

key levels are mentioned on chart

breakout with good intensity of volume

chart pattern inverted head and shoulder neckline breakout

macd in weekly positive crossover and uptick

macd in daily positive and uptick

macd in hourly positive and uptick above zeroline

rsi in daily uptick and b/o

rsi in hourly above 60s and 70s

adx dmi in hourly

upper bollinger challenged in hourly

Disclaimer
I am not sebi registered analyst
My studies are for educational purpose only
Consult your financial advisor before trading or investing
I am not responsible for your profits and losses
wave structure could be like this
key levels are mentioned on chart
breakout with good intensity of volume
chart pattern inverted head and shoulder neckline breakout
macd in weekly positive crossover and uptick
macd in daily positive and uptick
macd in hourly positive and uptick above zeroline
rsi in daily uptick and b/o
rsi in hourly above 60s and 70s
adx dmi in hourly
upper bollinger challenged in hourly
Disclaimer
I am not sebi registered analyst
My studies are for educational purpose only
Consult your financial advisor before trading or investing
I am not responsible for your profits and losses

YouTube: youtube.com/@rk_charts
Telegram : t.me/RK_Charts
Twitter : @charts_rk
Email : rkcharts@gmail. com
Disclaimer.
I am not sebi registered analyst.
My studies are for educational purpose only.
Telegram : t.me/RK_Charts
Twitter : @charts_rk
Email : rkcharts@gmail. com
Disclaimer.
I am not sebi registered analyst.
My studies are for educational purpose only.
관련 발행물
면책사항
해당 정보와 게시물은 금융, 투자, 트레이딩 또는 기타 유형의 조언이나 권장 사항으로 간주되지 않으며, 트레이딩뷰에서 제공하거나 보증하는 것이 아닙니다. 자세한 내용은 이용 약관을 참조하세요.
YouTube: youtube.com/@rk_charts
Telegram : t.me/RK_Charts
Twitter : @charts_rk
Email : rkcharts@gmail. com
Disclaimer.
I am not sebi registered analyst.
My studies are for educational purpose only.
Telegram : t.me/RK_Charts
Twitter : @charts_rk
Email : rkcharts@gmail. com
Disclaimer.
I am not sebi registered analyst.
My studies are for educational purpose only.
관련 발행물
면책사항
해당 정보와 게시물은 금융, 투자, 트레이딩 또는 기타 유형의 조언이나 권장 사항으로 간주되지 않으며, 트레이딩뷰에서 제공하거나 보증하는 것이 아닙니다. 자세한 내용은 이용 약관을 참조하세요.