
Chart Analysis:
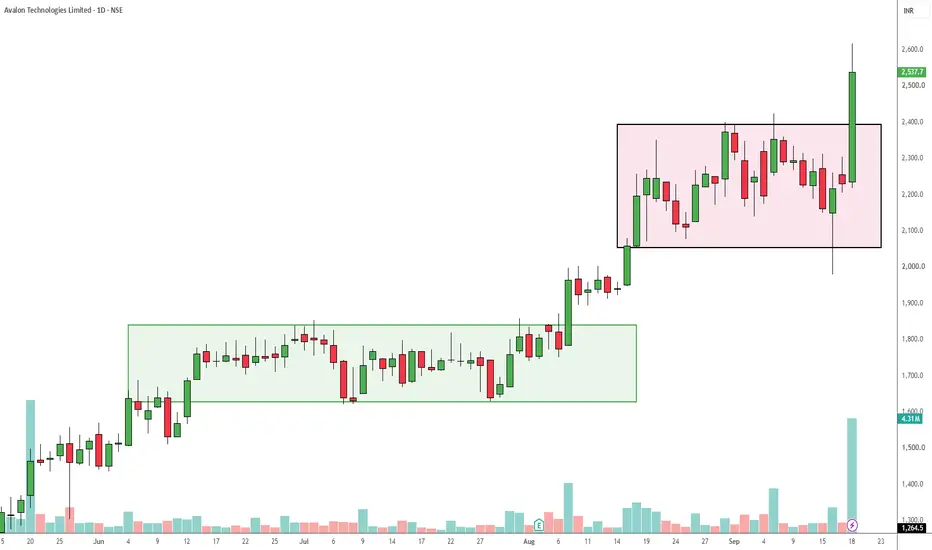
The daily chart for Avalon Technologies Limited (NSE: AVALON) illustrates a classic multi-stage markup phase.
After an initial accumulation and breakout from the lower base (green box), the stock established a secondary consolidation range (pink box) roughly between the 2,050 and 2,400 levels.
In the most recent session, AVALON delivered a decisive bullish breakout above the 2,400 resistance level, gaining +13.80% to close at 2,537.7.
This price action is supported by a massive volume spike of 4.31M shares, which strongly validates the breakout's momentum and suggests heavy buying interest.
Trade Setup:
Entry Point: Entry can be considered near the Current Market Price (2,537.7) for aggressive momentum follow-through, or ideally on a pullback and retest of the previous resistance-turned-support level near 2,400 for a stronger risk-to-reward ratio.
Target: Based on the depth of the previous consolidation box (approximately 350 points from 2,050 to 2,400), an initial technical target is projected around 2,750.
A secondary psychological target sits at the 3,000 mark.
Stop Loss: To manage downside risk, a stop loss could be placed just below the breakout candle's low at 2,218.3 for tighter risk management, or below the primary consolidation support near 2,050 to allow the trade more room to breathe.
The daily chart for Avalon Technologies Limited (NSE: AVALON) illustrates a classic multi-stage markup phase.
After an initial accumulation and breakout from the lower base (green box), the stock established a secondary consolidation range (pink box) roughly between the 2,050 and 2,400 levels.
In the most recent session, AVALON delivered a decisive bullish breakout above the 2,400 resistance level, gaining +13.80% to close at 2,537.7.
This price action is supported by a massive volume spike of 4.31M shares, which strongly validates the breakout's momentum and suggests heavy buying interest.
Trade Setup:
Entry Point: Entry can be considered near the Current Market Price (2,537.7) for aggressive momentum follow-through, or ideally on a pullback and retest of the previous resistance-turned-support level near 2,400 for a stronger risk-to-reward ratio.
Target: Based on the depth of the previous consolidation box (approximately 350 points from 2,050 to 2,400), an initial technical target is projected around 2,750.
A secondary psychological target sits at the 3,000 mark.
Stop Loss: To manage downside risk, a stop loss could be placed just below the breakout candle's low at 2,218.3 for tighter risk management, or below the primary consolidation support near 2,050 to allow the trade more room to breathe.

면책사항
해당 정보와 게시물은 금융, 투자, 트레이딩 또는 기타 유형의 조언이나 권장 사항으로 간주되지 않으며, 트레이딩뷰에서 제공하거나 보증하는 것이 아닙니다. 자세한 내용은 이용 약관을 참조하세요.
면책사항
해당 정보와 게시물은 금융, 투자, 트레이딩 또는 기타 유형의 조언이나 권장 사항으로 간주되지 않으며, 트레이딩뷰에서 제공하거나 보증하는 것이 아닙니다. 자세한 내용은 이용 약관을 참조하세요.