
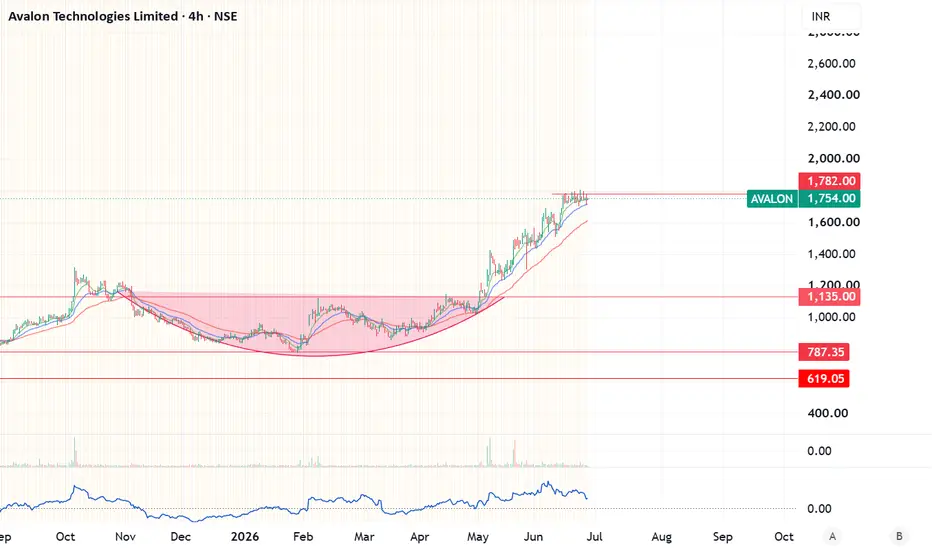
Avalon Technologies continues to exhibit a strong Stage-2 uptrend, supported by a well-defined rounding base breakout and sustained buying momentum. The stock has delivered an impressive rally from the ₹800–1,100 accumulation zone and is now consolidating just below its all-time high area.
The current price action indicates healthy consolidation after a sharp up move rather than weakness, suggesting that buyers are absorbing supply near the resistance zone.
Current Price
₹1,754
Trend Structure
✅ Strong long-term uptrend
✅ Trading above 20 EMA, 50 EMA and 200 EMA
✅ Higher Highs & Higher Lows intact
✅ Strong relative strength versus the broader market
✅ Healthy consolidation after a vertical rally
✅ No signs of distribution yet
The stock appears to be preparing for its next directional move.
Pattern Analysis
The chart shows:
Large Rounding Bottom Formation
Stage-2 Trend Continuation
Bullish Flag / Rectangle consolidation near highs
Institutional accumulation visible after breakout above ₹1,135.
Unlike weak breakouts that quickly reverse, Avalon has held above its breakout level for several months, indicating strong conviction from market participants.
Key Technical Levels
Immediate Support
₹1,700
₹1,630
₹1,550
Major Resistance
₹1,800–1,820 (Current breakout zone)
A decisive close above this zone could trigger the next leg of the rally.
Positional Trade Setup
Aggressive Entry
₹1,720–1,760
Accumulate on minor pullbacks while the stock remains above ₹1,700.
Conservative Entry
Wait for a daily/weekly close above ₹1,820 with above-average volumes.
This would confirm a fresh breakout and reduce the probability of a false move.
Targets
Target Price
Target 1 ₹1,950
Target 2 ₹2,150
Target 3 ₹2,400
Long-Term Target ₹2,700+
Stop Loss
₹1,620 (Closing Basis)
For short-term swing traders, a tighter stop below ₹1,680 can also be considered depending on risk appetite.
Risk-Reward
Potential Upside: 25–40%
Downside Risk: 7–9%
Risk-Reward: Approximately 1:3
This is an attractive setup provided the breakout is confirmed.
The current price action indicates healthy consolidation after a sharp up move rather than weakness, suggesting that buyers are absorbing supply near the resistance zone.
Current Price
₹1,754
Trend Structure
✅ Strong long-term uptrend
✅ Trading above 20 EMA, 50 EMA and 200 EMA
✅ Higher Highs & Higher Lows intact
✅ Strong relative strength versus the broader market
✅ Healthy consolidation after a vertical rally
✅ No signs of distribution yet
The stock appears to be preparing for its next directional move.
Pattern Analysis
The chart shows:
Large Rounding Bottom Formation
Stage-2 Trend Continuation
Bullish Flag / Rectangle consolidation near highs
Institutional accumulation visible after breakout above ₹1,135.
Unlike weak breakouts that quickly reverse, Avalon has held above its breakout level for several months, indicating strong conviction from market participants.
Key Technical Levels
Immediate Support
₹1,700
₹1,630
₹1,550
Major Resistance
₹1,800–1,820 (Current breakout zone)
A decisive close above this zone could trigger the next leg of the rally.
Positional Trade Setup
Aggressive Entry
₹1,720–1,760
Accumulate on minor pullbacks while the stock remains above ₹1,700.
Conservative Entry
Wait for a daily/weekly close above ₹1,820 with above-average volumes.
This would confirm a fresh breakout and reduce the probability of a false move.
Targets
Target Price
Target 1 ₹1,950
Target 2 ₹2,150
Target 3 ₹2,400
Long-Term Target ₹2,700+
Stop Loss
₹1,620 (Closing Basis)
For short-term swing traders, a tighter stop below ₹1,680 can also be considered depending on risk appetite.
Risk-Reward
Potential Upside: 25–40%
Downside Risk: 7–9%
Risk-Reward: Approximately 1:3
This is an attractive setup provided the breakout is confirmed.

면책사항
해당 정보와 게시물은 금융, 투자, 트레이딩 또는 기타 유형의 조언이나 권장 사항으로 간주되지 않으며, 트레이딩뷰에서 제공하거나 보증하는 것이 아닙니다. 자세한 내용은 이용 약관을 참조하세요.
면책사항
해당 정보와 게시물은 금융, 투자, 트레이딩 또는 기타 유형의 조언이나 권장 사항으로 간주되지 않으며, 트레이딩뷰에서 제공하거나 보증하는 것이 아닙니다. 자세한 내용은 이용 약관을 참조하세요.