
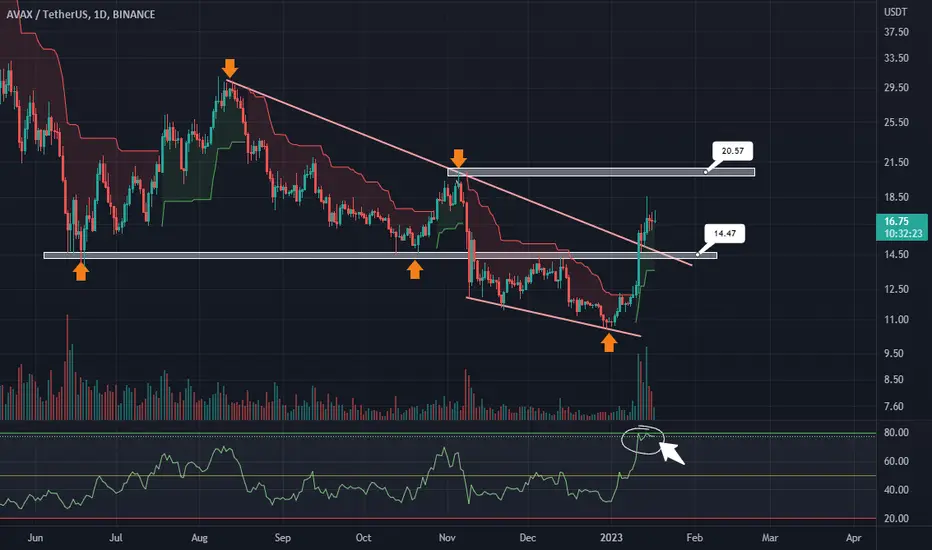
Here we can the daily chart of "AVAXUSDT" it has a horizontal SUPPORT at "14.47" and a horizontal RESISTANCE at "20.57". As we can see the candle already has taken breakout from the trendline with a high volume and if the candle retests the support zone then we can definetly look for a long opportunity from that zone and can expect a terget of "20.57" till then keep an eye on the support zone. And you can also see that the chart is making a double bottom and the pattern gets complete ot the resistance "20.57". Make trade ENTRY at the "14.47" zone with a TIGHT STOPLOSS at "13.90" and the TARGET ZONE at "20.57".
ENJOY !!!
ENJOY !!!

면책사항
해당 정보와 게시물은 금융, 투자, 트레이딩 또는 기타 유형의 조언이나 권장 사항으로 간주되지 않으며, 트레이딩뷰에서 제공하거나 보증하는 것이 아닙니다. 자세한 내용은 이용 약관을 참조하세요.
면책사항
해당 정보와 게시물은 금융, 투자, 트레이딩 또는 기타 유형의 조언이나 권장 사항으로 간주되지 않으며, 트레이딩뷰에서 제공하거나 보증하는 것이 아닙니다. 자세한 내용은 이용 약관을 참조하세요.