
Hi everyone,
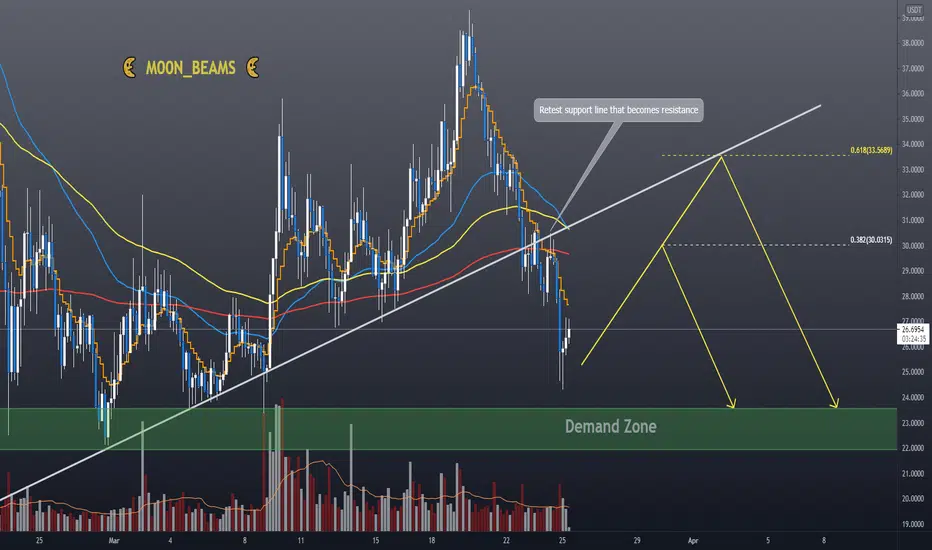
Two days ago we saw AVAX testing and failing its support trend line. The break-out to the bottom side was confirmed when retesting the support trend line that acted as resistance. When looking at the price action, bearish signals were in play (shooting start & engulfing candles).
As highlighted in the chart there is a possibility to fall lower to the indicated demand zone. This zone has been tested several time and acts as a strong support.
As these corrections are normal market cycles, I am stull bullish on Avalanche in the long run!
🌜 Please like and leave a comment 🌜
This is not financial advice
Two days ago we saw AVAX testing and failing its support trend line. The break-out to the bottom side was confirmed when retesting the support trend line that acted as resistance. When looking at the price action, bearish signals were in play (shooting start & engulfing candles).
As highlighted in the chart there is a possibility to fall lower to the indicated demand zone. This zone has been tested several time and acts as a strong support.
As these corrections are normal market cycles, I am stull bullish on Avalanche in the long run!
🌜 Please like and leave a comment 🌜
This is not financial advice
노트
Demand zone re-tested.Let's see if the bounce is strong enough to continue to the upside.
Update will follow

면책사항
해당 정보와 게시물은 금융, 투자, 트레이딩 또는 기타 유형의 조언이나 권장 사항으로 간주되지 않으며, 트레이딩뷰에서 제공하거나 보증하는 것이 아닙니다. 자세한 내용은 이용 약관을 참조하세요.
면책사항
해당 정보와 게시물은 금융, 투자, 트레이딩 또는 기타 유형의 조언이나 권장 사항으로 간주되지 않으며, 트레이딩뷰에서 제공하거나 보증하는 것이 아닙니다. 자세한 내용은 이용 약관을 참조하세요.