
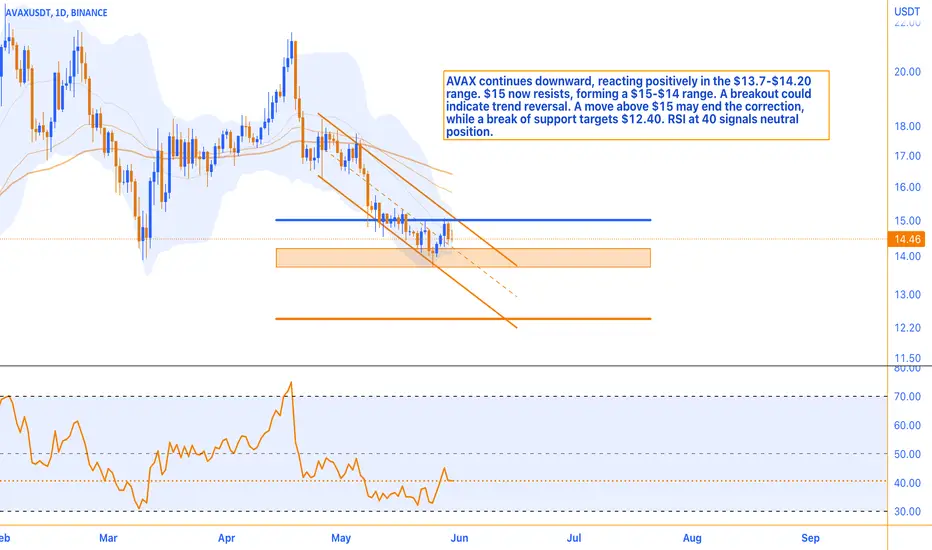
During the preceding month, AVAX experienced a continuous decline, aligning with the predictions outlined in the previous analysis, until reaching the support level as indicated on the chart. Notably, the price range of $13.7-$14.20, depicted in blue, generated a favorable positive response. However, the $15 mark, which initially served as a support level, has now transitioned into a short-term resistance, leading to the establishment of a trading range between $15 and $14.
Furthermore, within the 4-hour timeframe, it would be prudent to anticipate the breach of the upper boundary of the channel, which can be depicted by a downward trend line or channel. Such a development would signal a forthcoming trend reversal in the days ahead. Consequently, in the weekly timeframe, should the price surpass the $15 range once again, it would imply a likely conclusion to the ongoing correction. Conversely, should market selling pressure intensify and the current support level for AVAX be breached, the subsequent robust and reactive range can be expected around $12.40.
Additionally, it should be noted that the Relative Strength Index (RSI) currently stands at 40. The RSI, a technical indicator, represents the strength and momentum of price movements. A reading of 40 indicates a neutral position, suggesting a balanced state between buying and selling pressures in the market.
Furthermore, within the 4-hour timeframe, it would be prudent to anticipate the breach of the upper boundary of the channel, which can be depicted by a downward trend line or channel. Such a development would signal a forthcoming trend reversal in the days ahead. Consequently, in the weekly timeframe, should the price surpass the $15 range once again, it would imply a likely conclusion to the ongoing correction. Conversely, should market selling pressure intensify and the current support level for AVAX be breached, the subsequent robust and reactive range can be expected around $12.40.
Additionally, it should be noted that the Relative Strength Index (RSI) currently stands at 40. The RSI, a technical indicator, represents the strength and momentum of price movements. A reading of 40 indicates a neutral position, suggesting a balanced state between buying and selling pressures in the market.

Join the free Telegram channel
💎 Telegram Channel: t.me/MonoCoin_Public
🔔 Bot: t.me/MonoCoinSignal_Bot?start=starter_tv
🌐 Website: MonoCoin.net
⭐️ 5-Star TrustPilot: trustpilot.com/review/monocoin.net
💎 Telegram Channel: t.me/MonoCoin_Public
🔔 Bot: t.me/MonoCoinSignal_Bot?start=starter_tv
🌐 Website: MonoCoin.net
⭐️ 5-Star TrustPilot: trustpilot.com/review/monocoin.net
면책사항
해당 정보와 게시물은 금융, 투자, 트레이딩 또는 기타 유형의 조언이나 권장 사항으로 간주되지 않으며, 트레이딩뷰에서 제공하거나 보증하는 것이 아닙니다. 자세한 내용은 이용 약관을 참조하세요.
Join the free Telegram channel
💎 Telegram Channel: t.me/MonoCoin_Public
🔔 Bot: t.me/MonoCoinSignal_Bot?start=starter_tv
🌐 Website: MonoCoin.net
⭐️ 5-Star TrustPilot: trustpilot.com/review/monocoin.net
💎 Telegram Channel: t.me/MonoCoin_Public
🔔 Bot: t.me/MonoCoinSignal_Bot?start=starter_tv
🌐 Website: MonoCoin.net
⭐️ 5-Star TrustPilot: trustpilot.com/review/monocoin.net
면책사항
해당 정보와 게시물은 금융, 투자, 트레이딩 또는 기타 유형의 조언이나 권장 사항으로 간주되지 않으며, 트레이딩뷰에서 제공하거나 보증하는 것이 아닙니다. 자세한 내용은 이용 약관을 참조하세요.