
🔍 Analysis:
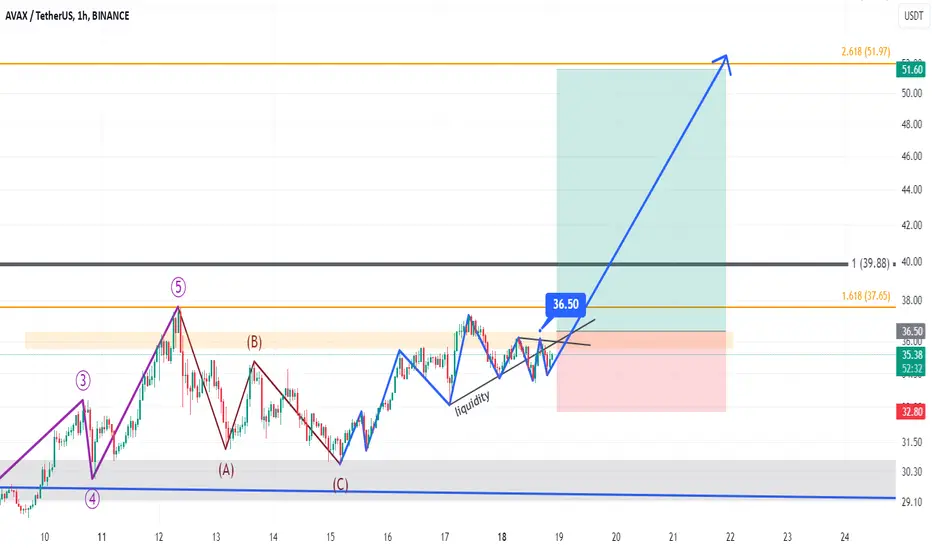
In the AVAX chart, an Inverse Head and Shoulders pattern has formed, signaling a potential strong upward move. Sellers attempted to push the price lower, but this failure resulted in liquidity absorption at these levels, indicating weakness in selling pressure and the entry of new buyers.
📈 Entry Conditions:
Enter after the price breaks and stabilizes above the $36.50 neckline of the inverse head and shoulders pattern.
🛡️ Stop Loss:
Place the stop loss at $32.80 (below the key support and right shoulder).
🎯 Target Price:
Target is $51.60.
⚠️ Key Notes:
The neckline break should be confirmed with high trading volume. This signal, after liquidity absorption, can lead to a powerful upward move. Don’t forget to manage risk properly!
In the AVAX chart, an Inverse Head and Shoulders pattern has formed, signaling a potential strong upward move. Sellers attempted to push the price lower, but this failure resulted in liquidity absorption at these levels, indicating weakness in selling pressure and the entry of new buyers.
📈 Entry Conditions:
Enter after the price breaks and stabilizes above the $36.50 neckline of the inverse head and shoulders pattern.
🛡️ Stop Loss:
Place the stop loss at $32.80 (below the key support and right shoulder).
🎯 Target Price:
Target is $51.60.
⚠️ Key Notes:
The neckline break should be confirmed with high trading volume. This signal, after liquidity absorption, can lead to a powerful upward move. Don’t forget to manage risk properly!

면책사항
해당 정보와 게시물은 금융, 투자, 트레이딩 또는 기타 유형의 조언이나 권장 사항으로 간주되지 않으며, 트레이딩뷰에서 제공하거나 보증하는 것이 아닙니다. 자세한 내용은 이용 약관을 참조하세요.
면책사항
해당 정보와 게시물은 금융, 투자, 트레이딩 또는 기타 유형의 조언이나 권장 사항으로 간주되지 않으며, 트레이딩뷰에서 제공하거나 보증하는 것이 아닙니다. 자세한 내용은 이용 약관을 참조하세요.