
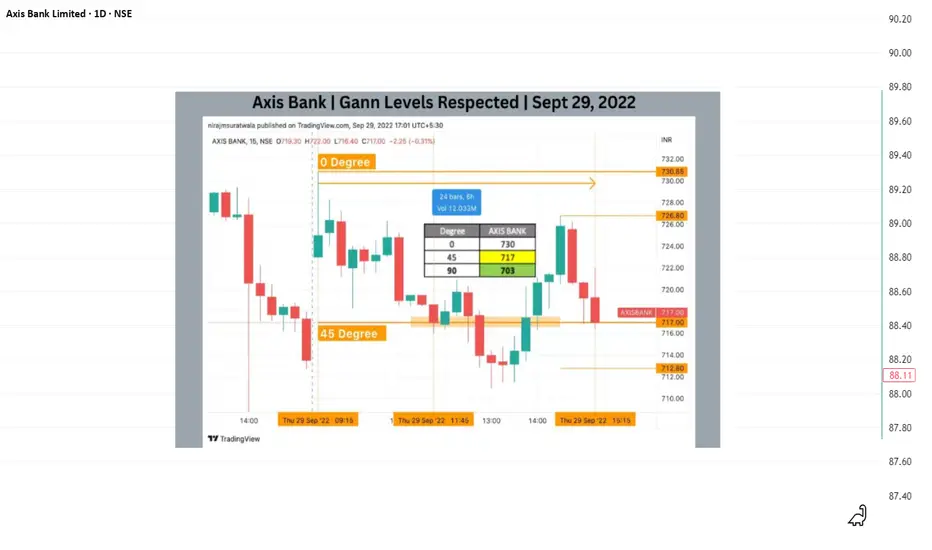
This idea demonstrates a historical intraday case study using the WD Gann Square of 9 to identify price capacity and reversal zones.
On 29 September 2022, Axis Bank started the session near ₹730, which was used as the 0-degree (0°) reference on the Square of 9.
Using Square of 9 calculations, the next important degree levels were identified as:
45° → ₹717
90° → ₹703
During the mid-session decline, price reached the 45-degree level (₹717) well before the 2:30 PM time threshold, completing its normal intraday price capacity.
As per Gann’s price–time geometry, early completion of a degree move often leads to a temporary reaction or reversal.
Axis Bank respected this level and reacted from the ₹717 zone, confirming the validity of the Square of 9 projection.
This case highlights how degree-based price mapping, when combined with time awareness, can help traders define logical intraday reaction zones instead of relying on lagging indicators.
📌 Key Square of 9 Levels
0° → 730
45° → 717
90° → 703
📘 Educational Takeaways
Square of 9 defines price symmetry
Time confirms strength or exhaustion
Early degree completion increases reaction probability
Structure replaces emotional trading decisions
Disclaimer:
This idea is shared for educational and chart-study purposes only. It does not constitute trading advice.
On 29 September 2022, Axis Bank started the session near ₹730, which was used as the 0-degree (0°) reference on the Square of 9.
Using Square of 9 calculations, the next important degree levels were identified as:
45° → ₹717
90° → ₹703
During the mid-session decline, price reached the 45-degree level (₹717) well before the 2:30 PM time threshold, completing its normal intraday price capacity.
As per Gann’s price–time geometry, early completion of a degree move often leads to a temporary reaction or reversal.
Axis Bank respected this level and reacted from the ₹717 zone, confirming the validity of the Square of 9 projection.
This case highlights how degree-based price mapping, when combined with time awareness, can help traders define logical intraday reaction zones instead of relying on lagging indicators.
📌 Key Square of 9 Levels
0° → 730
45° → 717
90° → 703
📘 Educational Takeaways
Square of 9 defines price symmetry
Time confirms strength or exhaustion
Early degree completion increases reaction probability
Structure replaces emotional trading decisions
Disclaimer:
This idea is shared for educational and chart-study purposes only. It does not constitute trading advice.

관련 발행물
면책사항
해당 정보와 게시물은 금융, 투자, 트레이딩 또는 기타 유형의 조언이나 권장 사항으로 간주되지 않으며, 트레이딩뷰에서 제공하거나 보증하는 것이 아닙니다. 자세한 내용은 이용 약관을 참조하세요.
관련 발행물
면책사항
해당 정보와 게시물은 금융, 투자, 트레이딩 또는 기타 유형의 조언이나 권장 사항으로 간주되지 않으며, 트레이딩뷰에서 제공하거나 보증하는 것이 아닙니다. 자세한 내용은 이용 약관을 참조하세요.