
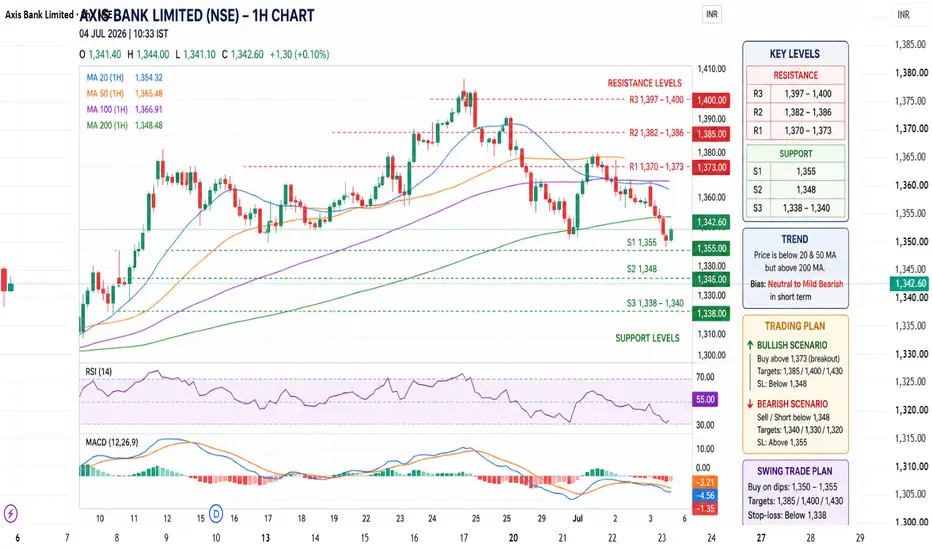
Current Trend
The stock is trading above its 20, 50, 100, and 200-day moving averages, which indicates that the medium- to long-term trend remains positive. RSI is around 55, suggesting neutral-to-mild bullish momentum rather than an overbought condition.
Key Support Levels
₹1,355 – Immediate support
₹1,348 – Strong support
₹1,338–1,340 – Major demand zone; a break below this could weaken the trend.
Key Resistance Levels
₹1,370–1,373 – Immediate resistance
₹1,382–1,386 – Next hurdle
₹1,397–1,400 – Strong breakout level.
Trading Analysis
Bullish scenario: A sustained move above ₹1,370–1,373 with strong volume can open the path toward ₹1,385 and then ₹1,400.
Bearish scenario: If the stock falls below ₹1,348, selling pressure may increase, with the next support near ₹1,338.
Swing Trading Plan
Buy on dips: ₹1,350–1,355 (if price shows reversal)
Breakout buy: Above ₹1,373 on strong volume
Targets: ₹1,385 → ₹1,400 → ₹1,430
Stop-loss: Below ₹1,338 (or adjust based on your risk tolerance)
Overall, the technical structure remains constructive to mildly bullish, with banking stocks continuing to show relative strength in the broader market.
If you're trading intraday, BTST, or looking at a 1–3 month swing, let me know your timeframe and I can provide more specific entry, target, and stop-loss levels.

관련 발행물
면책사항
해당 정보와 게시물은 금융, 투자, 트레이딩 또는 기타 유형의 조언이나 권장 사항으로 간주되지 않으며, 트레이딩뷰에서 제공하거나 보증하는 것이 아닙니다. 자세한 내용은 이용 약관을 참조하세요.
관련 발행물
면책사항
해당 정보와 게시물은 금융, 투자, 트레이딩 또는 기타 유형의 조언이나 권장 사항으로 간주되지 않으며, 트레이딩뷰에서 제공하거나 보증하는 것이 아닙니다. 자세한 내용은 이용 약관을 참조하세요.