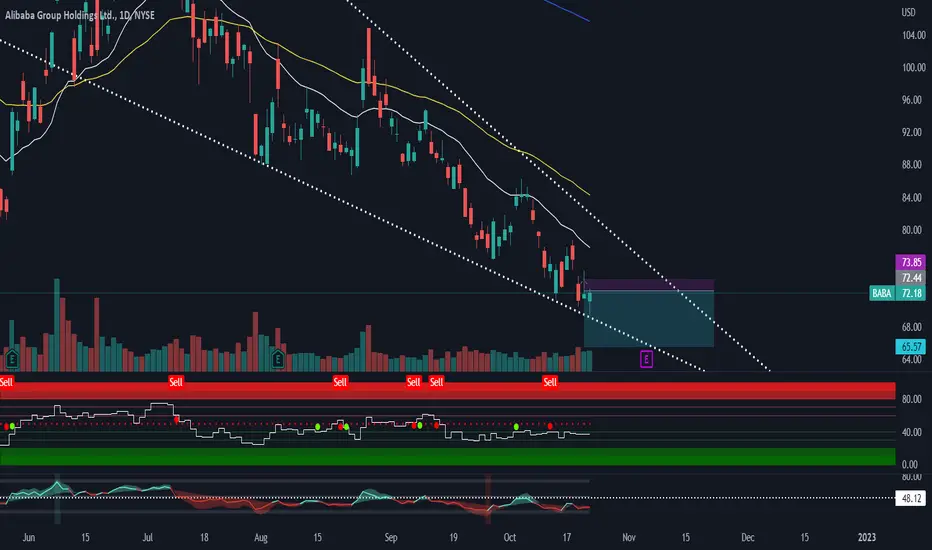
 BABA overall indicates a bearish momentum on the daily chart. Though it has formed a downward wedge, it still has time to continue to fall before change of momentum to bullish. Question is, how far will it go before a turnaround to the upside. On Trendsi Indicators; Overall momentum is showing bearish, with red EMA (middle band), money momentum (white line) trading under with a sell signal. 3 indicators showing a bearish momentum. But we all know how the market can change up Ina blink of an eye. Will definitely monitor and keep you guys update.

면책사항
해당 정보와 게시물은 금융, 투자, 트레이딩 또는 기타 유형의 조언이나 권장 사항으로 간주되지 않으며, 트레이딩뷰에서 제공하거나 보증하는 것이 아닙니다. 자세한 내용은 이용 약관을 참조하세요.
면책사항
해당 정보와 게시물은 금융, 투자, 트레이딩 또는 기타 유형의 조언이나 권장 사항으로 간주되지 않으며, 트레이딩뷰에서 제공하거나 보증하는 것이 아닙니다. 자세한 내용은 이용 약관을 참조하세요.