
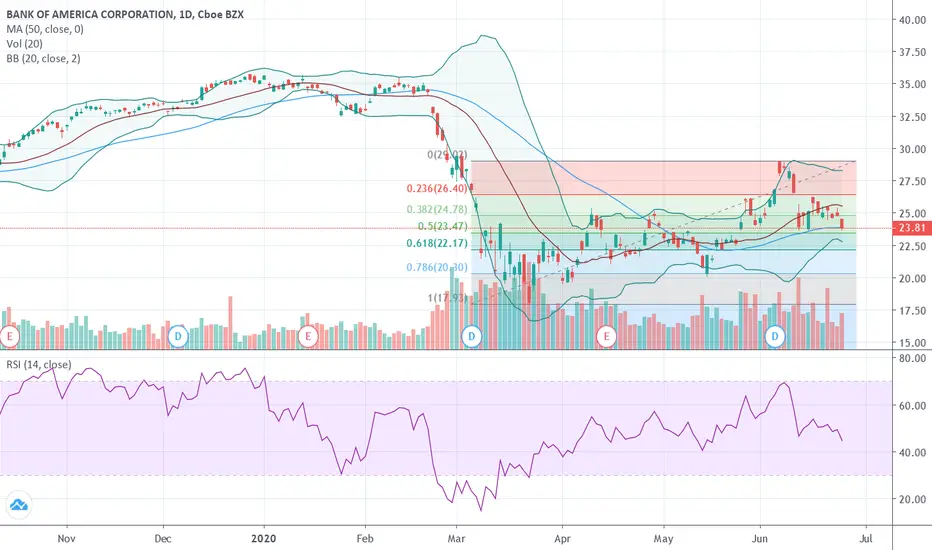
Hello Everyone! Today quite a weird close for BAC few cents below its 50 moving average, this moving average sustained the price action since the lows of March, is this behaviour a sign of weakness ? It might be, as it had all chances to close above this level and it finished below.
Price is trading in an important area, very close to the 50% Fibonacci retracement, it might take any direction.
For north direction we have to see closing above the 50 moving average (23,87) to show signs of bullishness, for south direction watch the next hourly close below that level tomorrow.
Thanks for reading and post a comment if you like to do that and....may the market be with us!
노트
The history is repeating : price bounced again from its 50 sma. Not only : the daily candle is a bullish engulfing, a bullish signal that most of the time do not need further confirmation
면책사항
해당 정보와 게시물은 금융, 투자, 트레이딩 또는 기타 유형의 조언이나 권장 사항으로 간주되지 않으며, 트레이딩뷰에서 제공하거나 보증하는 것이 아닙니다. 자세한 내용은 이용 약관을 참조하세요.
면책사항
해당 정보와 게시물은 금융, 투자, 트레이딩 또는 기타 유형의 조언이나 권장 사항으로 간주되지 않으며, 트레이딩뷰에서 제공하거나 보증하는 것이 아닙니다. 자세한 내용은 이용 약관을 참조하세요.