
JuNk BoNdS & The Sub Prime SPX Connection
Hola gente hermosa de este hermoso mundo!
All the market OG's talk of bonds and their importance. Heres a look into a big part of what they are telling you. I mean, they are the funding mechanism for the biggest fraudsters. It's all good though they don't have to report anything and can claim fake financials, just trust them and the alphabet boys.
Are private credit funds the speculators dream machine of this land cycle? Are they the REITs, Thrifts, Savings and Loans, and mortgage backed securities of past booms and busts? Are they the products which make it possible to legally rob banks? That’s been my theory for the past 3 years since I read about this booming high risk debt machine. Banks were just beginning to play a deeper role as reporting and restrictions were lifted and risk migrated to pensions, insurance companies, and private credit.
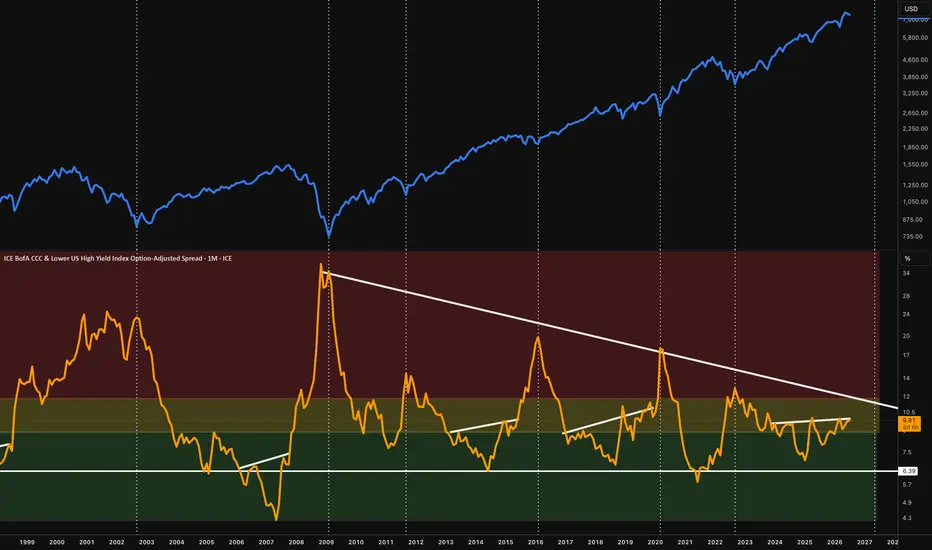
Today I’ll share a chart I find interesting. The junkiest junk bond yield spread which is like a credit risk oscillator once you add some regime thresholds. I’m comparing the CCC and lower OAS (orange) to the SPX (blue) on the 1 month chart.
The CCC & Lower OAS = The extra yield investors demand to hold the weakest junk bonds compared to US treasuries. The CCC is a rating for companies with very high default risk, and lower means it incorporates the junkiest of the junk. They are heavily indebted, fragile cash flow/distressed businesses, so naturally they are the first bonds to break when liquidity tightens.
OAS stands for option-adjusted spread = the yield spread over treasuries after removing distortions from call options (most junk bonds can be called) so as to isolate the true credit risk premium. I believe currently without adjusting for options it’s about 1% lower. So it seems OAS helps this metric lead better than a simple clean spread calculation.
I have green, yellow, and red colors highlighted over the CCC OAS spread which mark the regimes.
Green: Under 9% Buy backs active, easy credit, equity dips get bought, risk assets rise.
Yellow: 9%-12% weak companies struggle, market rallies are fragile, rotation out of risk assets begins.
Red:12% + Liquidity crisis, credit markets freezing, forced selling, equities continue down and bottom.
It’s breaking back into stressed territory highlighted in yellow, as its heading into a squeeze on this descending triangle. A break above 12% and the triangle we enter the true crisis regime, more downside in most cryptos and Stocks, then as the demanded rate tops out, historically this was the bottom in stocks.
I’m expecting investors to require a higher rate for holding an increasingly more risky product. The cracks are beginning to really surface now IMO. I’m not calling for a crisis, but I am calling for patience, and will be watching 12% on this series.
Peace love and prosperity to all!
All the market OG's talk of bonds and their importance. Heres a look into a big part of what they are telling you. I mean, they are the funding mechanism for the biggest fraudsters. It's all good though they don't have to report anything and can claim fake financials, just trust them and the alphabet boys.
Are private credit funds the speculators dream machine of this land cycle? Are they the REITs, Thrifts, Savings and Loans, and mortgage backed securities of past booms and busts? Are they the products which make it possible to legally rob banks? That’s been my theory for the past 3 years since I read about this booming high risk debt machine. Banks were just beginning to play a deeper role as reporting and restrictions were lifted and risk migrated to pensions, insurance companies, and private credit.
Today I’ll share a chart I find interesting. The junkiest junk bond yield spread which is like a credit risk oscillator once you add some regime thresholds. I’m comparing the CCC and lower OAS (orange) to the SPX (blue) on the 1 month chart.
The CCC & Lower OAS = The extra yield investors demand to hold the weakest junk bonds compared to US treasuries. The CCC is a rating for companies with very high default risk, and lower means it incorporates the junkiest of the junk. They are heavily indebted, fragile cash flow/distressed businesses, so naturally they are the first bonds to break when liquidity tightens.
OAS stands for option-adjusted spread = the yield spread over treasuries after removing distortions from call options (most junk bonds can be called) so as to isolate the true credit risk premium. I believe currently without adjusting for options it’s about 1% lower. So it seems OAS helps this metric lead better than a simple clean spread calculation.
I have green, yellow, and red colors highlighted over the CCC OAS spread which mark the regimes.
Green: Under 9% Buy backs active, easy credit, equity dips get bought, risk assets rise.
Yellow: 9%-12% weak companies struggle, market rallies are fragile, rotation out of risk assets begins.
Red:12% + Liquidity crisis, credit markets freezing, forced selling, equities continue down and bottom.
It’s breaking back into stressed territory highlighted in yellow, as its heading into a squeeze on this descending triangle. A break above 12% and the triangle we enter the true crisis regime, more downside in most cryptos and Stocks, then as the demanded rate tops out, historically this was the bottom in stocks.
I’m expecting investors to require a higher rate for holding an increasingly more risky product. The cracks are beginning to really surface now IMO. I’m not calling for a crisis, but I am calling for patience, and will be watching 12% on this series.
Peace love and prosperity to all!

면책사항
해당 정보와 게시물은 금융, 투자, 트레이딩 또는 기타 유형의 조언이나 권장 사항으로 간주되지 않으며, 트레이딩뷰에서 제공하거나 보증하는 것이 아닙니다. 자세한 내용은 이용 약관을 참조하세요.
면책사항
해당 정보와 게시물은 금융, 투자, 트레이딩 또는 기타 유형의 조언이나 권장 사항으로 간주되지 않으며, 트레이딩뷰에서 제공하거나 보증하는 것이 아닙니다. 자세한 내용은 이용 약관을 참조하세요.