
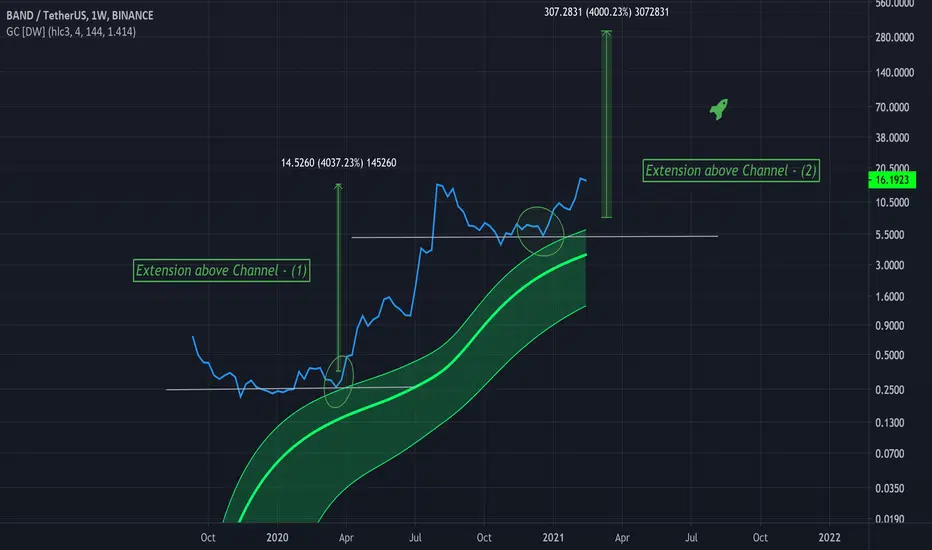
Within the green circles touches on the Gaussian channel can be seen, well, clearly on the first one, the second one is a bit above.
This is a great bounce area for price as price is in a full bull trend, as shown by the Gaussian indicator.
This is the chart for BANDUSDT, and if this second circle acts as a touch on the Gaussian indicator a strong bounce upward could occur.
And if history holds any merit, a 4000% move up could be in play.
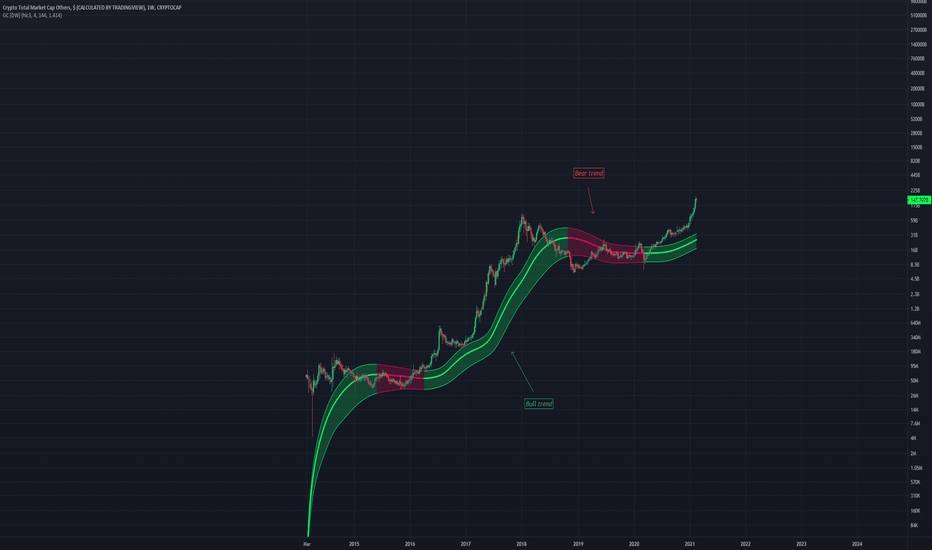
Above is a chart that has a link to this indicator in the comments.
It is very helpful.
This is a great bounce area for price as price is in a full bull trend, as shown by the Gaussian indicator.
This is the chart for BANDUSDT, and if this second circle acts as a touch on the Gaussian indicator a strong bounce upward could occur.
And if history holds any merit, a 4000% move up could be in play.
Above is a chart that has a link to this indicator in the comments.
It is very helpful.

면책사항
해당 정보와 게시물은 금융, 투자, 트레이딩 또는 기타 유형의 조언이나 권장 사항으로 간주되지 않으며, 트레이딩뷰에서 제공하거나 보증하는 것이 아닙니다. 자세한 내용은 이용 약관을 참조하세요.
면책사항
해당 정보와 게시물은 금융, 투자, 트레이딩 또는 기타 유형의 조언이나 권장 사항으로 간주되지 않으며, 트레이딩뷰에서 제공하거나 보증하는 것이 아닙니다. 자세한 내용은 이용 약관을 참조하세요.