
Let's analyze the new index for my channel today.
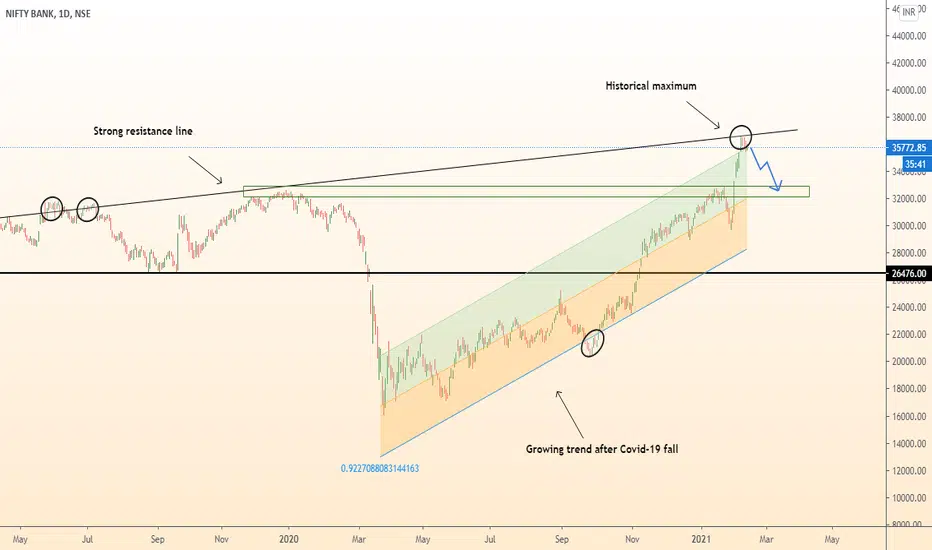
The price came to a strong resistance (line of 2017).
It touched resistance at 36607.15.
And this is the historical maximum price.
As a result, the price began to fall from strong resistance.
The situation was similar in 2019.
Then, after touching and fixing on the line, the price fell and broke through the strong level of 26476.00.
And as a result, only support (base of the channel) 12946.15 began to grow.
The formation of this trend happened at the pandemic fall.
Now I expect the price to fall again after touching a strong resistance.
It will go down to the support zone (first touch in December 2019).
The target is 32552.70.
--------------------
Share your opinion in the comments and support the idea with likes.
Thank you for your support!
The price came to a strong resistance (line of 2017).
It touched resistance at 36607.15.
And this is the historical maximum price.
As a result, the price began to fall from strong resistance.
The situation was similar in 2019.
Then, after touching and fixing on the line, the price fell and broke through the strong level of 26476.00.
And as a result, only support (base of the channel) 12946.15 began to grow.
The formation of this trend happened at the pandemic fall.
Now I expect the price to fall again after touching a strong resistance.
It will go down to the support zone (first touch in December 2019).
The target is 32552.70.
--------------------
Share your opinion in the comments and support the idea with likes.
Thank you for your support!

관련 발행물
면책사항
해당 정보와 게시물은 금융, 투자, 트레이딩 또는 기타 유형의 조언이나 권장 사항으로 간주되지 않으며, 트레이딩뷰에서 제공하거나 보증하는 것이 아닙니다. 자세한 내용은 이용 약관을 참조하세요.
면책사항
해당 정보와 게시물은 금융, 투자, 트레이딩 또는 기타 유형의 조언이나 권장 사항으로 간주되지 않으며, 트레이딩뷰에서 제공하거나 보증하는 것이 아닙니다. 자세한 내용은 이용 약관을 참조하세요.