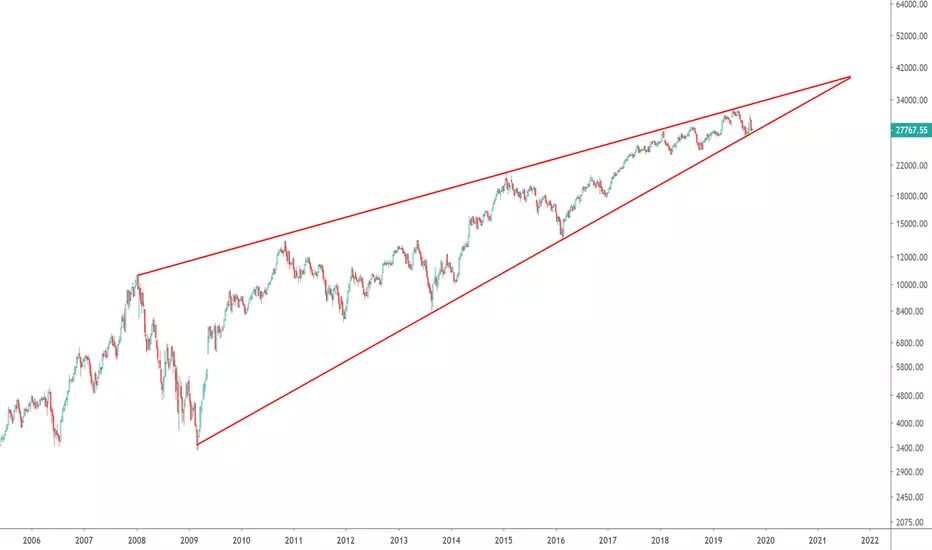
This rising wedge of  BANKNIFTY in LOG scale starts from 2008 and is active even today on October of 2019. The scale of this chart pattern is now more than 10 years which is massive in terms of time and this can only increase the significance of the chart pattern. As you can see from the chart the bottom support line has never been broken on a closing basis. I am not forecasting any trade here, but the break of this wedge to the bottom will definitely not support the current bullishness in the Indian market after the Corporate tax cuts.
I will update this if and once we break any of the two lines.
Follow us on Twitter
BANKNIFTY in LOG scale starts from 2008 and is active even today on October of 2019. The scale of this chart pattern is now more than 10 years which is massive in terms of time and this can only increase the significance of the chart pattern. As you can see from the chart the bottom support line has never been broken on a closing basis. I am not forecasting any trade here, but the break of this wedge to the bottom will definitely not support the current bullishness in the Indian market after the Corporate tax cuts. I will update this if and once we break any of the two lines.
Follow us on Twitter
액티브 트레이드
Bottom line is still acting as support.
Ideas for educational purposes only.
면책사항
해당 정보와 게시물은 금융, 투자, 트레이딩 또는 기타 유형의 조언이나 권장 사항으로 간주되지 않으며, 트레이딩뷰에서 제공하거나 보증하는 것이 아닙니다. 자세한 내용은 이용 약관을 참조하세요.
Ideas for educational purposes only.
면책사항
해당 정보와 게시물은 금융, 투자, 트레이딩 또는 기타 유형의 조언이나 권장 사항으로 간주되지 않으며, 트레이딩뷰에서 제공하거나 보증하는 것이 아닙니다. 자세한 내용은 이용 약관을 참조하세요.