
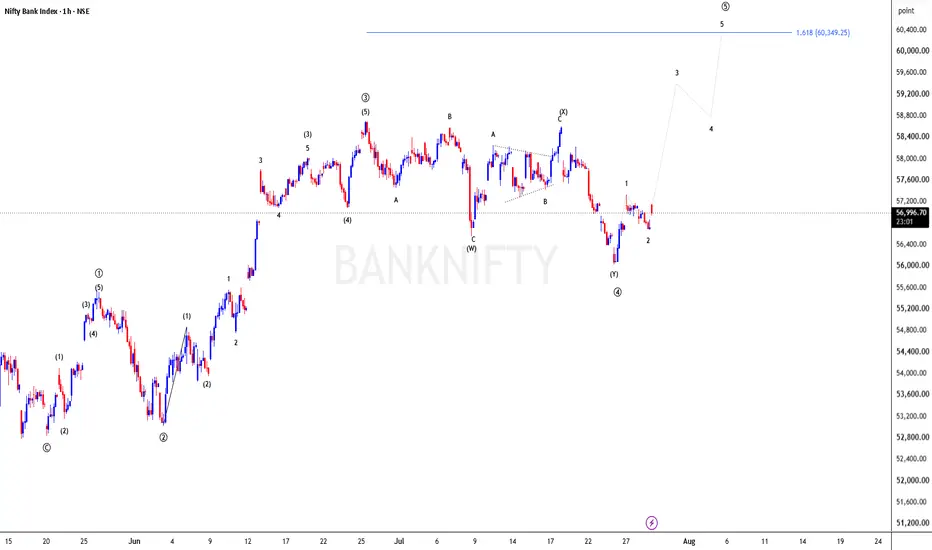
You can use this professional description for your chart:
---
## **BANKNIFTY 1H – Elliott Wave Analysis**
The chart suggests that **Bank Nifty has likely completed a corrective W-X-Y structure**, with wave **(Y)** forming near an important support zone. The recent decline appears to be exhausting, increasing the probability of a fresh impulsive advance.
The projected scenario indicates the beginning of a new **five-wave bullish impulse (1-2-3-4-5)**:
* **Wave 1:** Initial recovery from the (Y) low.
* **Wave 2:** A shallow pullback to confirm support.
* **Wave 3:** Expected to be the strongest and longest bullish wave, potentially breaking previous swing highs.
* **Wave 4:** Healthy correction after Wave 3.
* **Wave 5:** Final push toward the marked resistance zone (blue horizontal line), completing the impulsive cycle.
### **Key Observation**
* W-X-Y correction appears complete.
* Strong support has developed around the recent low.
* Bullish momentum is expected if price remains above the Wave (Y) low.
* A breakout above the recent swing highs would confirm the bullish Elliott Wave count.
**Trading Perspective:**
Maintain a bullish bias while price holds above the recent swing low. Confirmation of Wave 1 and Wave 2 increases the probability of an extended Wave 3 rally toward higher resistance levels.

면책사항
해당 정보와 게시물은 금융, 투자, 트레이딩 또는 기타 유형의 조언이나 권장 사항으로 간주되지 않으며, 트레이딩뷰에서 제공하거나 보증하는 것이 아닙니다. 자세한 내용은 이용 약관을 참조하세요.
면책사항
해당 정보와 게시물은 금융, 투자, 트레이딩 또는 기타 유형의 조언이나 권장 사항으로 간주되지 않으며, 트레이딩뷰에서 제공하거나 보증하는 것이 아닙니다. 자세한 내용은 이용 약관을 참조하세요.