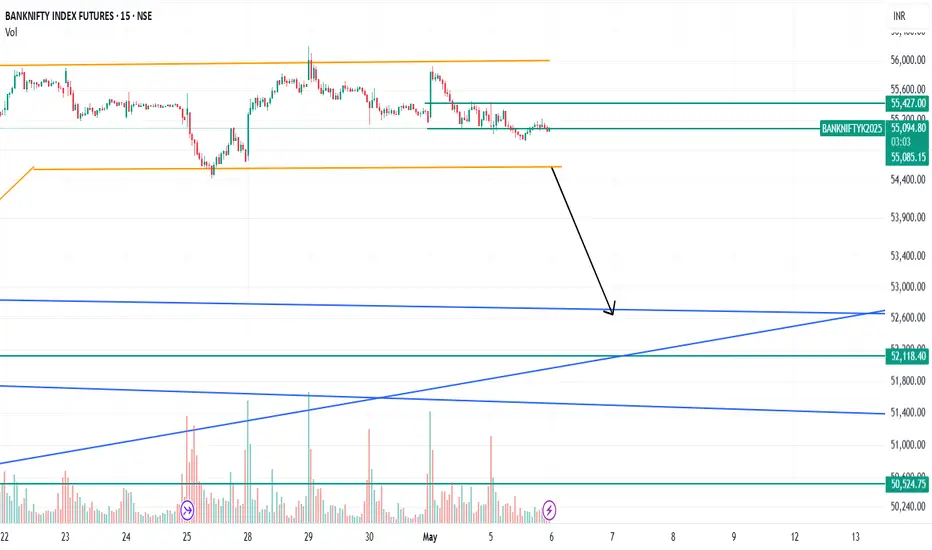
Key Support & Resistance Zones:
Resistance Zone (Top of range): Around 55,400.
Support Zone (Bottom of range): Around 55,000.
Next Major Support below the range:
54,500 ( Immediate Support)
52,700 ( Trenline Support)
52,129 (Horizontal Trenline Support)
Trendlines:
The chart shows a strong ascending trendline from earlier lows.(yellow coloured trendline)
But Looking at Recent Highs bulls are loosing momentum at 55800 to 55900 tried 4 time to break but failed to break range which shows weakness on bull side
What to Look :
If range break from 54900 with high volume and bar candle we can move down towards the immediate support then we can expect a bounce at range support at 54500
Or If Gap up or Gap Down can shift the momentum

면책사항
해당 정보와 게시물은 금융, 투자, 트레이딩 또는 기타 유형의 조언이나 권장 사항으로 간주되지 않으며, 트레이딩뷰에서 제공하거나 보증하는 것이 아닙니다. 자세한 내용은 이용 약관을 참조하세요.
면책사항
해당 정보와 게시물은 금융, 투자, 트레이딩 또는 기타 유형의 조언이나 권장 사항으로 간주되지 않으며, 트레이딩뷰에서 제공하거나 보증하는 것이 아닙니다. 자세한 내용은 이용 약관을 참조하세요.